Cash-Flow Beta Doesn’t Explain the Value Premium
A new research paper related mainly to:
#26 – Value (Book-to-Market) Anomaly
Authors: Zhou
Title: Can Cash-Flow Beta Explain the Value Premium?
Link: https://papers.ssrn.com/sol3/papers.cfm?abstract_id=3244791
Abstract:
It is well documented that the cash flow beta can partly explain the source of the value premium. This paper presents an empirical test that cast doubt on this widely accepted belief. We double sort the stocks with their value and quality dimension and obtain four corner portfolios: (A) expensive quality, (B) cheap junk, (C) cheap quality and (D) expensive junk stocks. Prior research has shown that the value premium concentrates on cheap quality minus expensive junk (i.e. undervalued minus overvalued) but is not significant in cheap junk minus expensive quality stocks. If cash-flow beta is the source of the value premium, we would expect a larger cash-flow beta difference between the cheap quality and expensive junk portfolio. However, our empirical test shows that β_CF ((B) cheap junk) – β_CF ((A) expensive quality) >>β_CF ((C) cheap quality)-β_CF ((D) expensive junk). In other words, B minus A does not contribute to the profit of the value premium but contribute most to the difference of the cash flow beta between value and growth portfolios. Therefore, our result may serve as evidence that the cash flow beta may only spuriously explain the value premium. Or, at least, the cash-flow risk premium estimated in the portfolio regression approach is biased.
Notable quotations from the academic research paper:
"The value premium is one of the most important anomalies in the field of asset pricing. It is well known that the market beta fails to explain the value premium in the dataset after 1963.
Campbell and Vuolteenaho (2004) first proposed a “good beta, bad beta” model to solve this dilemma. They decompose the traditional market beta into two components: A good beta is the beta that measures a stock’s covariance with the temporary market movement or discount rate news, which is usually induced by changing market sentiment and varying risk aversion; A bad beta measures a stock’s comovement with market-wide fundamental cash-flow news. Campbell and Vuolteenaho (2004) and Cohen, Polk, Vuolteenaho(2009) argue that investors will regard wealth decrease induced by discount rate news as less significant because it tends to be temporary and the investors will be compensated by better future investment opportunity in an increased discount rate environment. A rational investor will demand higher return for the bad beta than the good beta.
Together with Campbell and Vuolteenaho (2004), Cohen, Polk, Vuolteenaho(2009), Campbell, Polk and Vuolteenaho (2010) and Da and Warachka (2009) among others, use different proxy for the cash-flow news and find that value stocks have a higher cash-flow beta than growth stocks. They conclude that cash-flow beta is one of the sources of the value premium. In this paper, we present an empirical test that question this widely accepted belief.
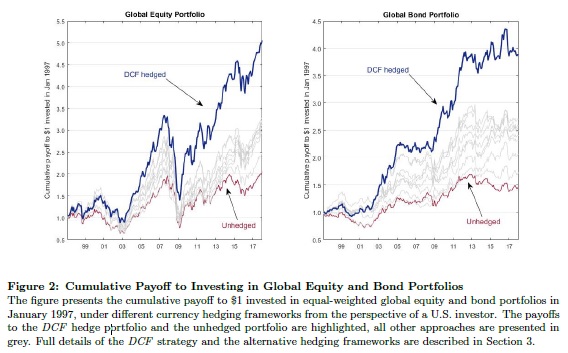
Our test double-sorts the stocks by value and quality dimension. In a conceptual simplified picture, Figure 1 illustrates four groups of stocks: (A) high quality, high price (expensive quality), (B) low quality, low price (cheap junk), (C) high quality, low price (cheap quality), and (D) low quality, high price (expensive junk). The price of portfolio A and B is thought to be “right” as their price is more aligned with the quality. Portfolio C (D) is the undervalued (overvalued) stocks.
High price portfolio A and D are growth stocks, and low price portfolio B and C are value stocks. The value premium is the return of ( + ) − ( + ) = ( − ) + ( − ) . ( − ) and ( − ) are represented respectively by the light blue and dark blue arrow in Figure 1.
When the price is “right”, the value premium is not significant. The value premium is concentrated on ( − ), but not on ( − ). The return of the four portfolio have the relationship: R > R ≈ R > R .
If the cash flow beta is the source of the value premium and the value premium is concentrated on ( − ), one would naturally expect that f( ) − f( ) ≫ f( ) − f( ), in which, f is the cash flow beta. However, in our
test, we find the opposite results: f( ) − f( ) ≫ f( ) − f( ). ( − ) does not contribute to the profit of the value premium while f( ) − f( ) contribute the most to the cash-flow beta difference between the value and growth portfolio.
If the cash-flow beta represents a risk, we take most of the risk in the value-junk minus growth quality portfolio, but we earn no profit or even negative profit. We take very little or negative risk in the value-quality minus growth-junk portfolio, but we earn most of the profit of the value premium. We need to find a plausible explanation to this phenomena before we conclude that the cash-flow risk is the source of the value premium. A fundamental reason of our result is that, on the value dimension, higher return links to a higher cash-flow beta, while on the quality dimension, higher return links to a lower cash-flow beta."
Are you looking for more strategies to read about? Check http://\/\/new-fmhwbzh6ghd9hede.swedencentral-01.azurewebsites.net/Screener
Do you want to see an overview of our database of trading strategies? Check https://\/\/new-fmhwbzh6ghd9hede.swedencentral-01.azurewebsites.net/Chart
Do you want to know how we are searching new strategies? Check https://\/\/new-fmhwbzh6ghd9hede.swedencentral-01.azurewebsites.net/Home/How
Do you want to know more about us? Check http://\/\/new-fmhwbzh6ghd9hede.swedencentral-01.azurewebsites.net/Home/About
Follow us on:
Facebook: https://www.facebook.com/quantpedia/
Twitter: https://twitter.com/quantpedia