Out-of-sample Dataset Before the “Sample”: Pervasive Anomalies Before 1926

Data are the key to systematic investing/trading strategies. The hypotheses testing, risk or return evaluations, correlations, and factor loadings rely on past data and backtests. With an increasing speed of publication in finance, critiques of quantitative strategies have emerged. Strategies seem to decay in alpha, post-publication returns tend to be lower, and many strategies become insignificant once rigorously tested (in or out-of-sample). Moreover, some might even appear profitable purely by chance and the repetitive examination of the same dataset, such as CRSP stocks after 1963. 

Is there any solution to overcome these limitations? Partially, the design of the novel machine learning strategies consisting of training, validation, and testing sets might help. Perhaps the most crucial part of such a scheme is the usage of the purely out-of-sample dataset. In this regard, the novel research by Baltussen et al. (2021) provides several valuable findings for the most recognized factors. The authors constructed a database of U.S. stocks, including dividends and market caps for 1488 major stocks from 1866 to 1926. The sample can be described as the pre-CRSP period, including independent, pre-publication, and “out-of-sample” data that can be a perfect test for the factors utilized today. 

Continue reading »

Community Alpha of QuantConnect – Part 2: Social Trading Factor Strategies

This blog post is the continuation of series about Quantconnect’s Alpha market strategies. Part 1 can be found here. This part is related to the factor strategies notoriously known from the majority of asset classes.

Overall, the factors on alpha strategies provide insightful results that could be utilized. The results particularly point to excluding the most extreme strategies based on various past distribution’s characteristics.

Stay tuned for the 3rd and 4th part of this series, where we will explore factor meta-strategies built on top of the QuantConnect’s Alpha Market.

Continue reading »

An Important Analysis of Stock Momentum and Reversal Factors

Can we explain stock momentum by industry, sector or factor momentum? Moreover, a similar question could be raised about the short-term reversal. The novel research by Li and Turkington (2021) uses a robust regression model to divide momentum and reversal returns into the main drivers. The individual momentum anomaly that broader market groups do not fully explain exists in the whole sample but is statistically weak. On the other hand, the reversal anomaly is highly significant. Secondly, the traditional 12-months momentum can be better explained by the factor momentum than the industry or sector momentum. Still, the industries, industry groups, sectors, and even factors have distinct drivers, and the anomalies seem different.

Continue reading »

Trading Index (TRIN) – Formula, Calculation & Trading Strategy in Python

Short-term mean reversion trading on equity indexes is a popular trading style. Often, price-based technical indicators like RSI, CCI are used to assess if the stock market is in overbought or oversold conditions. A new research article written by Chainika Thakar and Rekhit Pachanekar explores a different indicator – TRIN, which compares the number of advancing and declining stocks to the advancing and declining volume. TRIN’s advantage is that it’s cross-sectionally based and its calculation uses not only price but also volume information. Thakar& Pachanekar’s research paper is useful for fans of indicator’s based trading strategies and offers a short introduction to TRIN’s calculation together with an example of mean-reversion market timing strategy written in a python code.

Authors: Chainika Thakar, Rekhit Pachanekar

Title: Trading Index (TRIN) – Formula, Calculation & Strategy in Python

Continue reading »

Stock Price Overreaction to ESG Controversies

Nobody can doubt that in the recent period, ESG investing has significantly grown and is a staple part of the financial markets. The academic literature has also grown with the popularity of ESG investing. The negative, mixed and positive results for ESG scores in portfolios have evolved, and generally, there is a consent that ESG scoring can be a vital part of the portfolio management process. It can be observed that in the past, the ESG scores were not priced in the equity market and still, the ESG is not priced in the corporate bond market (apart from Europe). Nowadays, the investors react to the ESG scores, but the research paper of Cui and Docherty (2020) has novel insights that investors may react too much to the ESG. Their research shows that investors overreact to the negative ESG events and stocks connected with negative ESG events sharply fall, but the prices have mean-reverting properties. As a result, there is a reversal after bad ESG events. Stocks firstly sharply fall, but then their prices are reverted to the previous values. Therefore, this paper is interesting from the market pricing or efficiency point, but it also can be utilized by a reversal investor.

Continue reading »

Fund Flows of Active Funds Significantly Affect Value and Size Factors

A new academic paper related to:

#25 – Size Factor
#26 – Value (Book-to-Market) Factor

Authors: Hung, Song, Xiang

Title: Fragile Factor Premia

Link: https://papers.ssrn.com/sol3/papers.cfm?abstract_id=3312837

Abstract:

We demonstrate that returns and volatilities of the Fama-French size and value factors are significantly determined by non-fundamental flow-induced trading from actively managed equity mutual funds. Mutual fund flows are largely ignorant about systematic risks. These non-fundamental shifts in demand induce large return heterogeneity within and across the Fama-French size and book-to-market portfolios. We show that aggregate mutual fund flow- induced trades across the size and book-to-market spectrum significantly influence the size and value premia, followed by large subsequent reversals. We also find that the expected volatilities of mutual funds’ flow-induced trades strongly predict future factor volatilities. Our results highlight the importance of non-fundamental demand shocks in determining factor premia and factor volatilities.

Notable quotations from the academic research paper:

"Mutual fund trading has a considerable price impact on individual stocks. However, some more recent work suggests that mutual fund investors are largely ignorant about systematic risks, when allocating capitals among mutual funds. Empirically, it remains unclear how trades induced by the non-fundamental mutual fund flows impact returns and volatilities of size and value, the two prominent factors. This paper aims to fi ll this gap.

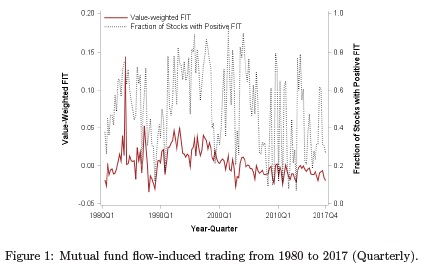
In our study, we use a bottom-up approach and estimate mutual fund flow-induced trading (FIT) for each stock-quarter from 1980 to 2017. In a nutshell, FIT measures the magnitude of flow-driven trading by the aggregate equity mutual fund industry on a particular stock in a given quarter. We use FIT rather than the entire realized trading of mutual funds because FIT only captures those trades that are driven by the demand shifts from mutual fund investors, which are largely ignorant about fundamentals

Fund flows

Our main fi ndings are as follows.

We fi nd that returns of the six FF size and book-to-market portfolios are largely determined by the uninformed mutual fund flow-induced trades. Within each of the six FF portfolios, stocks with higher FIT have higher return performance.

Mutual funds' flow-driven trades can even revert the positive size and value premia. That is, within the same book-to-market portfolios, we find large-cap stocks with above-median FIT outperform small-cap stocks with below-median FIT. Within the same size portfolios, growth stocks with above-median FIT outperform value stocks with below-median FIT.

Value & Size Factor

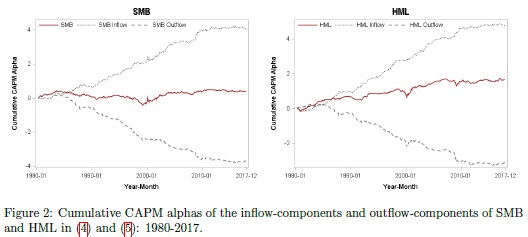
We decompose the value minus growth returns (HML) into two components: (i) value-inflow minus growth-outflow returns (HMLInflow) and (ii) value-outflow minus growth-inflow (HMLOutflow). We decompose the small minus big returns (SMB) into the sum of (i) small-inflow minus big-outflow returns (SMBInflow) and (ii) small-outflow minus big-inflow returns (SMBOutflow). Figure 2 report the average monthly returns and alphas of SMB, HML, and their inflow and outflow components.

In sum, we find that the size premium is due to the component of small-inflow stocks minus big-outflow stocks, while the value premium is due to the component of value-inflow stocks minus growth-outflow stocks."


Are you looking for more strategies to read about? Check http://\/\/new-fmhwbzh6ghd9hede.swedencentral-01.azurewebsites.net/Screener

Do you want to see performance of trading systems we described? Check http://\/\/new-fmhwbzh6ghd9hede.swedencentral-01.azurewebsites.net/Chart/Performance

Do you want to know more about us? Check http://\/\/new-fmhwbzh6ghd9hede.swedencentral-01.azurewebsites.net/Home/About


Follow us on:

Facebook: https://www.facebook.com/quantpedia/

Twitter: https://twitter.com/quantpedia


Continue reading »
QuantPedia
Privacy Overview

This website uses cookies so that we can provide you with the best user experience possible. Cookie information is stored in your browser and performs functions such as recognising you when you return to our website and helping our team to understand which sections of the website you find most interesting and useful.