The Best of Strategies for the Times of Crisis

We at Quantpedia are not the only ones who are interested in finding strategies that can be used to mitigate the impacts of the large equity corrections. We have already written a short article about a lottery/skewness strategy in commodities, which offers some protection in a time of crisis. Our users can also screen a list of strategies that can be used as a hedge/diversification for equity markets during downturns. A new research paper written by Harvey, Hoyle, Rattray, Sargaison, Taylor and Van Hemert explores the same question and analyzes the performance of different tools that investors could deploy during equity bear markets. We sincerely recommend it …

Authors: Harvey, Hoyle, Rattray, Sargaison, Taylor, Van Hemert

Title: The Best of Strategies for the Worst of Times: Can Portfolios be Crisis Proofed?

Link: https://papers.ssrn.com/sol3/papers.cfm?abstract_id=3383173

Abstract:

In the late stages of long bull markets, a popular question arises: What steps can an investor take to mitigate the impact of the inevitable large equity correction? However, hedging equity portfolios is notoriously difficult and expensive. We analyze the performance of different tools that investors could deploy. For example, continuously holding short-dated S&P 500 put options is the most reliable defensive method but also the most costly strategy. Holding ‘safe-haven’ US Treasury bonds produces a positive carry, but may be an unreliable crisis-hedge strategy, as the post-2000 negative bond-equity correlation is a historical rarity. Long gold and long credit protection portfolios sit in between puts and bonds in terms of both cost and reliability. Dynamic strategies that performed well during past drawdowns include: futures time-series momentum (which benefits from extended equity sell-offs) and a quality strategy that takes long/short positions in the highest/lowest quality company stocks (which benefits from a ‘flight-to-quality’ effect during crises). We examine both large equity drawdowns and recessions. We also provide some out-of-sample evidence of the defensive performance of these strategies relative to an earlier, related paper.

Notable quotations from the academic research paper:

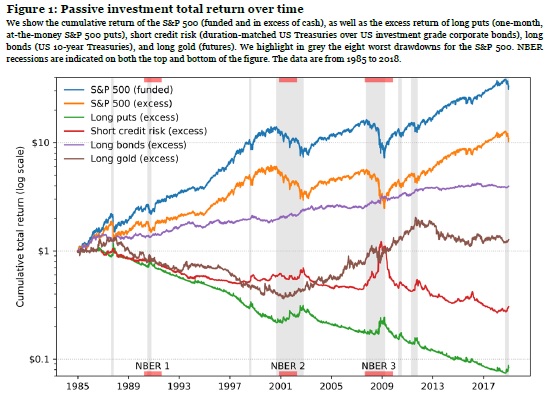
"The typical investment portfolio is highly concentrated in equities leaving investors vulnerable to large drawdowns. We examine the performance of a number of candidate defensive strategies, both active and passive, between 1985 and 2018, with a particular emphasis on the eight worst drawdowns (the instances where the S&P 500 fell by more than 15%) and three US recessions. To guard against overfitting, we provide out-of-sample evidence of the performance of these strategies in the 2018Q4 drawdown that occurred after we wrote an earlier, related paper.

We begin with two passive strategies, both of which benefit directly from a falling equity market. A strategy that buys, and then rolls, one-month S&P 500 put options performs well in each of the eight equity drawdown periods. However, it is very costly during the ‘normal’ times, which constitute 86% of our sample and expansionary (non-recession) times, which constitute 93% of our observations. As such, passive option protection seems too expensive to be a viable crisis hedge. A strategy that is long credit protection (short credit risk) also benefits during each of the eight equity drawdown periods, but in a more uneven manner, doing particularly well during the 2007-2009 Financial Crisis, which was a credit crisis. Nevertheless, the credit protection strategy is less costly during normal times and non-recessions than the put buying strategy.

Next, we consider so-called ‘safe-haven’ investments. A strategy that holds long positions in 10-year US Treasuries performed well in the post-2000 equity drawdowns, but was less effective during previous equity sell-offs. This is consistent with the negative bond-equity correlation witnessed post-2000, which is atypical from the longer historical perspective. As we move beyond the extreme monetary easing that has characterized the post-Financial Crisis period, it is possible that the bond-equity correlation may revert to the previous norm, rendering a long bond strategy a potentially unreliable crisis hedge. A long gold strategy generally performs better during crisis periods than at normal times, consistent with its reputation as a safe-haven security. However, its appeal as a crisis hedge is diminished by the fact that its long-run return, measured over the 1985-2018 period, is close to zero and that it carries substantial idiosyncratic risk unrelated to equity markets.

We then turn our attention to dynamic strategies.

Time-series momentum strategies add to winning positions (ride winners) and reduce losing positions (cut losers), much like a dynamic replication of an option straddle strategy. We show that such strategies performed well over the eight equity drawdowns and three recessions. We also explore limiting the equity exposure (no long positions allowed), which we find enhances the crisis performance.

Next, we consider long-short US equity strategies. A review of the factors proposed in the academic literature suggests that those that take long positions in high-quality and short positions in low-quality companies are most promising as crisis hedges, since they benefit from flights to quality when panic hits markets. The definition of a quality business is, of course, open to debate. However, broadly speaking, such companies will be profitable, growing, have safer balance sheets, and run investor-friendly policies in areas such as payout ratios. We examine a host of quality metrics, and illustrate the importance of a beta-neutral (common in practice) rather than a dollar-neutral (common in academic studies) portfolio construction.

performance of passive trading strategies

performance over drawdown period

"


Are you looking for more strategies to read about? Check http://\/\/new-fmhwbzh6ghd9hede.swedencentral-01.azurewebsites.net/Screener

Do you want to see performance of trading systems we described? Check http://\/\/new-fmhwbzh6ghd9hede.swedencentral-01.azurewebsites.net/Chart/Performance

Do you want to know more about us? Check http://\/\/new-fmhwbzh6ghd9hede.swedencentral-01.azurewebsites.net/Home/About


Follow us on:

Facebook: https://www.facebook.com/quantpedia/

Twitter: https://twitter.com/quantpedia

Youtube: https://www.youtube.com/channel/UC_YubnldxzNjLkIkEoL-FXg


Continue reading »

Using Deep Neural Networks to Enhance Time Series Momentum

A new research paper related to:

#118 – Time Series Momentum

Authors: Lim, Zohren, Roberts

Title: Enhancing Time Series Momentum Strategies Using Deep Neural Networks

Link: https://papers.ssrn.com/sol3/papers.cfm?abstract_id=3369195

Abstract:

While time series momentum is a well-studied phenomenon in finance, common strategies require the explicit definition of both a trend estimator and a position sizing rule. In this paper, we introduce Deep Momentum Networks — a hybrid approach which injects deep learning based trading rules into the volatility scaling framework of time series momentum. The model also simultaneously learns both trend estimation and position sizing in a data-driven manner, with networks directly trained by optimising the Sharpe ratio of the signal. Backtesting on a portfolio of 88 continuous futures contracts, we demonstrate that the Sharpe-optimised LSTM improved traditional methods by more than two times in the absence of transactions costs, and continue outperforming when considering transaction costs up to 2-3 basis points. To account for more illiquid assets, we also propose a turnover regularisation term which trains the network to factor in costs at run-time.

Notable quotations from the academic research paper:

"While numerous papers have investigated the use of machine learning for financial time series prediction, they typically focus on casting the underlying prediction problem as a standard regression or classification task – with regression models forecasting expected returns, and classification models predicting the direction of future price movements. This approach, however, could lead to suboptimal performance in the context time-series momentum for several reasons.

Firstly, sizing positions based on expected returns alone does not take risk characteristics into account – such as the volatility or skew of the predictive returns distribution — which could inadvertently expose signals to large downside moves. This is particularly relevant as raw momentum strategies without adequate risk adjustments, such as volatility scaling, are susceptible to large crashes during periods of market panic. Furthermore, even with volatility scaling – which leads to positively skewed returns distributions and long-option-like behaviour – trend following strategies can place more losing trades than winning ones and still be profitable on the whole – as they size up only into large but infrequent directional moves. The fraction of winning trades is a meaningless metric of performance, given that it cannot be evaluated independently from the trading style of the strategy. Similarly, high classification accuracies may not necessarily translate into positive strategy performance, as profitability also depends on the magnitude of returns in each class. In light of the deficiencies of standard supervised learning techniques, new loss functions and training methods would need to be explored for position sizing – accounting for tradeoffs between risk and reward.

In this paper, we introduce a novel class of hybrid models that combines deep learning-based trading signals with the volatility scaling framework used in time series momentum strategies – which we refer to as the Deep Momentum Networks (DMNs). This improves existing methods from several angles.

Firstly, by using deep neural networks to directly generate trading signals, we remove the need to manually specify both the trend estimator and position sizing methodology – allowing them to be learnt directly using modern time series prediction architectures.

Secondly, by utilising automatic differentiation in existing backpropagation frameworks, we explicitly optimise networks for risk-adjusted performance metrics, i.e. the Sharpe ratio, improving the risk profile of the signal on the whole.

Lastly, retaining a consistent framework with other momentum strategies also allows us to retain desirable attributes from previous works – specifically volatility scaling, which plays a critical role in the positive performance of time series momentum strategies. This consistency also helps when making comparisons to existing methods, and facilitates the interpretation of different components of the overall signal by practitioners.

performance of trading strategies

Referring to the cumulative returns plots for the rescaled portfolios in Exhibit 4, the benefits of direct outputs with Sharpe ratio optimisation can also be observed – with larger cumulative returns observed for linear, MLP and LSTM models compared to the reference benchmarks. Furthermore, we note the general underperformance of models which use standard regression and classification methods for trend estimation – hinting at the difficulties faced in selecting an appropriate position sizing function, and in optimising models to generate positions without accounting for risk."


Are you looking for more strategies to read about? Check http://\/\/new-fmhwbzh6ghd9hede.swedencentral-01.azurewebsites.net/Screener

Do you want to see performance of trading systems we described? Check http://\/\/new-fmhwbzh6ghd9hede.swedencentral-01.azurewebsites.net/Chart/Performance

Do you want to know more about us? Check http://\/\/new-fmhwbzh6ghd9hede.swedencentral-01.azurewebsites.net/Home/About


Follow us on:

Facebook: https://www.facebook.com/quantpedia/

Twitter: https://twitter.com/quantpedia

Youtube: https://www.youtube.com/channel/UC_YubnldxzNjLkIkEoL-FXg


Continue reading »

Time-Series Momentum Works Everywhere

It looks that time series momentum is one of the most prevalent effects in finance. Once again, an academic paper shows that it works in every corner of financial markets – in traditional assets, alternative assets and even in long short equity factors …

Authors: Babu, Levine, Ooi, Pedersen, Stamelos

Title: Trends Everywhere

Link: https://papers.ssrn.com/sol3/papers.cfm?abstract_id=3386035

Abstract:

We provide new out-of-sample evidence on trend-following investing by studying its performance for 82 securities not previously examined and 16 long-short equity factors. Specifically, we study the performance of time series momentum for emerging market equity index futures, fixed income swaps, emerging market currencies, exotic commodity futures, credit default swap indices, volatility futures, and long-short equity factors. We find that time series momentum has worked across these asset classes and across several trend horizons. We examine the co-movement of trends across asset classes and factors, the performance during different market environments, and discuss the implications for investors.

Notable quotations from the academic research paper:

"Our full data contains 156 assets, of which 58 are the “traditional assets” studied in the literature cited above, 82 are “alternative assets,” meaning futures, forwards, and swaps not previously studied, and 16 are “factors” constructed as long-short equity portfolios. In other words, we collect so much new data that the number of new assets outnumbers the “traditional assets” studied in the literature. While we broaden the universe, we only consider investable liquid assets or strategies.

We find strong evidence for time series momentum across the assets and factors that we study. Over our sample period, the gross Sharpe ratio of 12-month time series momentum for traditional assets is 1.17, and the strategy delivers an even higher Sharpe ratio of 1.34 for the alternative assets. The Sharpe ratio for long-short equity factors is 0.95, and, when we diversify across all three asset groups, the combined trend-following strategy yields a gross Sharpe ratio of 1.60.

Figure 1 reports the t-statistics from the regression, using lags ranging from 1 month to 60 months. Panel A reports the results for traditional assets. The positive t-statistics for the first 12 months indicate return continuation – that is, trends – and t-statistics larger than 2 in magnitude are statistically significant, consistent with earlier findings. For lags above 12 months, we see some negative coefficients, indicating trend reversals, although these tend to be statistically insignificant. Panel B extends the analysis to alternative assets, which also display strong return continuation for the first 12 months, and more mixed returns beyond 12 months. Panel C extends the analysis to equity factor portfolios, showing that time series predictability is feature of more than just traditional and alternative assets, but also of equity factors, with positive t-statistics across the most recent 12 months. These results demonstrate the remarkable pervasiveness of return continuation for the most recent 12 months, but not for returns beyond 12 months, across a range of assets and equity factors.

Traditional assets. Our data for traditional assets are the prices of 58 liquid futures and forwards, consisting of 9 developed equity index futures, 13 developed bond futures, 12 cross-currency forward pairs (from nine underlying currencies), and 24 commodity futures.

t-stat for traditional assets

Alternative assets. Our data for alternative assets consist of prices for 7 emerging market equity index futures, 17 fixed income swaps, 24 emerging market cross currency pairs, 21 commodity futures, 5 credit default swap indices, and 8 volatility futures.

t-stat for alternative assets

Equity factors. For equity factors, our data consist of 16 of the most well-cited and robust single-name stock selection factors

t-stat for factors

"


Are you looking for more strategies to read about? Check http://\/\/new-fmhwbzh6ghd9hede.swedencentral-01.azurewebsites.net/Screener

Do you want to see performance of trading systems we described? Check http://\/\/new-fmhwbzh6ghd9hede.swedencentral-01.azurewebsites.net/Chart/Performance

Do you want to know more about us? Check http://\/\/new-fmhwbzh6ghd9hede.swedencentral-01.azurewebsites.net/Home/About


Follow us on:

Facebook: https://www.facebook.com/quantpedia/

Twitter: https://twitter.com/quantpedia

Youtube: https://www.youtube.com/channel/UC_YubnldxzNjLkIkEoL-FXg


Continue reading »

Equity Momentum in Years 1820-1930

Once again, our favorite type of study – an out of sample research study based on data from 19th and beginning of 20th century.  Interesting research paper related to all equity momentum strategies …

Authors: Trigilia, Wang

Title: Momentum, Echo and Predictability: Evidence from the London Stock Exchange (1820-1930)

Link: https://papers.ssrn.com/sol3/papers.cfm?abstract_id=3373164

Abstract:

We study momentum and its predictability within equities listed at the London Stock Exchange (1820-1930). At the time, this was the largest and most liquid stock market and it was thinly regulated, making for a good laboratory to perform out-of-sample tests. Cross-sectionally, we find that the size and market factors are highly profitable, while long-term reversals are not. Momentum is the most profitable and volatile factor. Its returns resemble an echo: they are high in long-term formation portfolios, and vanish in short-term ones. We uncover momentum in dividends as well. When controlling for dividend momentum, price momentum loses significance and profitability. In the time-series, despite the presence of a few momentum crashes, dynamically hedged portfolios do not improve the performance of static momentum. We conclude that momentum returns are not predictable in our sample, which casts some doubt on the success of dynamic hedging strategies.

Notable quotations from the academic research paper:

"This paper studies momentum and its predictability in the context of the rst modern stock market, the London Stock Exchange (LSE), from the 1820s to the 1920s.

Factors' performance. Compared to the U.S. post-1926, we find that the market has been less profi table – averaging 5% annually (but also less volatile). Its Sharpe ratio has been 0.34, not too far from the 0.43 of CRSP. The Small-Minus-Big (SMB) factor delivered a 4.85% average annual return, much higher than that found in U.S. post-1926. The risk-free rate, as proxied by the interest on British Government's consols, has been close to 3.3% throughout the period, despite the many large changes in supply (i.e., in the outstanding stock of public debt). As for momentum (UMD), consistent with the existing evidence it has been the most profi table factor – with an average annual return close to 9% – and the most volatile – with 20% annual standard deviation.

Momentum in years 1820-1930

Dissecting momentum returns. Recent literature debates whether momentum is long or short term. In our sample, UMD profi ts strongly depend on the formation period: they average at 10.6% annually for long-term formation (12 to 7 months) and 3.8% for short-term formation (6 to 2 months). So, our out-of-sample test confi rms that momentum is better described as a within-year echo.

To investigate the role of fundamentals as drivers of price momentum, we construct two sets of earnings momentum portfolio. The first earnings momentum portfolio is constructed based on the past dividend paid by the firm relative to its market cap. The portfolio buys stocks of the highest dividend-paying firms over a 12 to 2 months formation period, and shorts the stocks of the lowest ones. We find strong evidence that our dividend momentum (DIV) strategy is pro fitable across our sample: it yields a 5% average annual return with a standard deviation of 12%.

The second earnings momentum portfolio is constructed based on the dividend innovations. Speci cally, we look at the change of dividend year to year, and construct the DIV portfolio. The portfolio buys stocks with the highest change in dividend paid and shorts the stocks with the lowest ones. The DIV portfolio yield an over 24% return with a standard deviation of only 13.2%.

To discern whether price momentum seems driven by dividend momentum, we also test whether the alpha of the static UMD portfolio remains signi ficant and positive after we control for the Fama-French three factors plus the dividend momentum portfolio. In the EW sample, price momentum delivers excess returns of about 8.8% after controlling for the Fama-French three factors, signifi cant at the 1%. However, introducing DIV momentum reduces the alpha to 2.9%, and the alpha is insigni ficantly di fferent from zero. As for VW portfolios, they deliver higher alphas but are less precisely estimated. In this case, the annualized alpha of price momentum drops by half from 11.2% to 5.8% after controlling for DIV momentum.

Momentum crashes. We find that the distribution of monthly momentum returns is left skewed and displays excess kurtosis. Within the five largest EW (VW) momentum crashes, investors lost 18% (26%) on average. The difference between the beta of the winners and that of the losers has been -2.4 (-3.5), on average, and the losses stemmed mostly from the performance of the losers, which averaged at 24% (21%) monthly return. We find little action in the winners portfolio, which returned on average 2% (-6%).

Predictability and dynamic hedging. Dynamic hedging consists in levering the portfolio when its realized volatility has been low and/or the market has been under-performing, and de-levering otherwise. We begin our analysis by looking at whether set of variables helps predicting momentum returns in our sample, and we find that it does not. Probably, this is because the crashes in our sample are more heterogeneous both in terms of origins and in terms of length. In particular, they do not necessarily occur when the market rebounds after a long downturn, and they tend to last for shorter periods of time. As a consequence, our out-of-sample test of the dynamic hedged UMD strategy shows that either it underperforms static momentum, or it does not improve its returns.

"


Are you looking for more strategies to read about? Check http://\/\/new-fmhwbzh6ghd9hede.swedencentral-01.azurewebsites.net/Screener

Do you want to see performance of trading systems we described? Check http://\/\/new-fmhwbzh6ghd9hede.swedencentral-01.azurewebsites.net/Chart/Performance

Do you want to know more about us? Check http://\/\/new-fmhwbzh6ghd9hede.swedencentral-01.azurewebsites.net/Home/About


Follow us on:

Facebook: https://www.facebook.com/quantpedia/

Twitter: https://twitter.com/quantpedia

Youtube: https://www.youtube.com/channel/UC_YubnldxzNjLkIkEoL-FXg


Continue reading »

Transaction Costs of Factor Strategies

A very important research papers related to all equity factor strategies …

Authors: Li, Chow, Pickard, Garg

Title: Transaction Costs of Factor Investing Strategies

Link: https://papers.ssrn.com/sol3/papers.cfm?abstract_id=3359947

Abstract:

Although hidden, implicit market impact costs of factor investing strategies may substantially erode the strategies' expected excess returns. The authors explain these market impacts costs and model them using rebalancing data of a suite of large and longstanding factor investing indices. They introduce a framework to assess the costs of rebalancing activities, and attribute these costs to characteristics such as rate of turnover and the concentration of turnover, which intuitively describe the strategies' demands on liquidity. The authors evaluate a number of popular factor-investing strategy implementations and identify how index construction methods, when thoughtfully designed, can reduce market impact costs.

Notable quotations from the academic research paper:

"Factor investing strategies have become increasingly popular. According to data from Morningstar Direct, assets under management (AUM) in factor investing ETFs and mutual funds across global markets increased from just below US$75 billion in 2005 to more than US$800 billion by the end of 2016.

In practice, when a provider rebalances an index, most managers tracking it execute the necessary transactions near the close of the rebalancing day in order to minimize their portfolio’s tracking error. The fund managers may appear to be perfectly tracking the index; in another words, minimizing implementation shortfall, which is the aggregate difference between the average traded price and the closing price of each of the index's underlying securities on the rebalancing day. Thus, the total implementation cost of an index fund could be perceived as merely the sum of the explicit costs associated with trading, such as commissions, taxes, ticker charges, and so forth. This notion misses the propagating market impact that trading has on the index’s value. The large volume of buy and sell orders for the same securities, executed at the same time, can result in securities prices moving against the managers, producing losses for both the index and the fund investors. This implicit cost is often overlooked because it is not visible when comparing a fund’s net asset value (NAV) and the index’s value; it can, however, be overwhelmingly large relative to the explicit costs for strategies with massive AUM. This article focuses on unmasking the market impact costs that arise from synchronous buying and selling.

We analyze the behavior of stocks that were traded during the rebalancing of 49 FTSE RAFI™ Indices (henceforth, “the indices”). We find significant evidence of market impact on the rebalancing day and a subsequent price reversal over the next four days. We find that the magnitude of price impact is predictable, because it is directly related to the security’s liquidity and the size of the trade.

Specifically, we identify that a fund incurs approximately 30 basis points (bps) of trading costs due to market impact for every 10% of a stock’s average daily volume (ADV) traded in aggregate by the factor investing index–tracking funds.

Market Impact

Our simple relationship of market impact versus the security’s liquidity and the size of the trade can be used to estimate the implicit transaction costs of rebalancing trades. We apply our model and evaluate the costs of an extended list of popular strategies with various turnover rates, trade sizes, levels of security liquidity, and number of rebalances. We find that, at a modest level of AUM, and assuming all rebalancing trades occur near the end of
the rebalancing date, the expected transaction costs can significantly erode the expected alpha as indicated by long-term historical backtests. Specifically, with as little as $10 billion in AUM, momentum indexing strategies can have trading costs of 200 bps or more. At the same level of assets, income strategies’ costs are in the 60–80 bps range, and quality strategies’ costs fall below 40 bps. We report the capacities, defined as AUM when expected costs reach a high and fixed level (50 bps a year), of these strategies. We also present an attribution model to relate costs to strategy characteristics and explain in detail how certain styles of investing—for instance, those that trade frequently and those that trade completely in and out of a few illiquid positions—require higher costs than others.

Liquidity characteristics

"


Are you looking for more strategies to read about? Check http://\/\/new-fmhwbzh6ghd9hede.swedencentral-01.azurewebsites.net/Screener

Do you want to see performance of trading systems we described? Check http://\/\/new-fmhwbzh6ghd9hede.swedencentral-01.azurewebsites.net/Chart/Performance

Do you want to know more about us? Check http://\/\/new-fmhwbzh6ghd9hede.swedencentral-01.azurewebsites.net/Home/About


Follow us on:

Facebook: https://www.facebook.com/quantpedia/

Twitter: https://twitter.com/quantpedia


Continue reading »

The Impact of Crowding on Alternative Risk Premiums

Related to all factor strategies …

Author: Baltas

Title: The Impact of Crowding in Alternative Risk Premia Investing

Link: https://papers.ssrn.com/sol3/papers.cfm?abstract_id=3360350

Abstract:

Crowding is a major concern for investors in the alternative risk premia space. By focusing on the distinct mechanics of various systematic strategies, we contribute to the discussion with a framework that provides insights on the implications of crowding on subsequent strategy performance. Understanding such implications is key for strategy design, portfolio construction, and performance assessment. Our analysis shows that divergence premia, like momentum, are more likely to underperform following crowded periods. Conversely, convergence premia, like value, show signs of outperformance as they transition into phases of larger investor flows.

Notable quotations from the academic research paper:

"Crowding risk is listed as one of the most important impediments for investing in alternative risk premia. We contribute to this industry debate by exploring the mechanics of the various ARP in the event of investor flows, and study the implications of crowdedness on subsequent performance.

The cornerstone of our methodology is the classification of the ARP strategies into divergence and convergence premia. Divergence premia, like momentum, lack a fundamental anchor and inherently embed a self-reinforcing mechanism (e.g. in momentum, buying outperforming assets, and selling underperforming ones). This lack of a fundamental anchor creates the coordination problem that Stein (2009) describes, which can ultimately have a destabilising effect.

Divergence factor

Conversely, convergence premia, like value, embed a natural anchor (e.g. the valuation spread between undervalued and overvalued assets) that acts as an self-correction mechanism (as undervalued assets are no longer undervalued if overbought). Extending Stein’s (2009) views, such dynamics suggest that investor flows are actually likely to have a stabilising effect for convergence premia.

Convergence premia

In order to test these hypotheses we use the pairwise correlation of factor-adjusted returns of assets in the same peer group (outperforming assets, undervalued assets and so on so forth) as a metric for crowding.

We provide empirical evidence in line with these hypotheses. Divergence premia within equity, commodity and currency markets are more likely to underperform following crowded periods.

All divergence premias

Whereas convergence premia show signs of outperformance as they transition into phases of higher investor flows.

All convergence premias"


Are you looking for more strategies to read about? Check http://\/\/new-fmhwbzh6ghd9hede.swedencentral-01.azurewebsites.net/Screener

Do you want to see performance of trading systems we described? Check http://\/\/new-fmhwbzh6ghd9hede.swedencentral-01.azurewebsites.net/Chart/Performance

Do you want to know more about us? Check http://\/\/new-fmhwbzh6ghd9hede.swedencentral-01.azurewebsites.net/Home/About


Follow us on:

Facebook: https://www.facebook.com/quantpedia/

Twitter: https://twitter.com/quantpedia


Continue reading »

Momentum In International Government Bonds Can Be Explained By Currency Momentum

A new academic paper related to:

#8 – Currency Momentum Factor

Authors: Zaremba, Kambouris

Title: The Sources of Momentum in International Government Bond Returns

Link: https://papers.ssrn.com/sol3/papers.cfm?abstract_id=3332942

Abstract:

This study aims to offer a new explanation for the momentum effect in international government bonds. Using cross-sectional and time-series tests, we examine a sample of bonds from 22 countries for the years 1980 through 2018. We document significant momentum profits that are not attributable to bond-specific risk factors, such as volatility or credit risk. The global bond momentum is driven by the returns on underlying foreign exchange rates. Controlling for currency movements fully explains the abnormal returns on momentum strategies in international government bonds. The results are robust to many considerations including alternative sorting periods, portfolio construction methods, as well as subperiod and subsample analysis.

Notable quotations from the academic research paper:

"The various types of momentum effects have also been documented in government bonds, implying that the fixed-income winners outperform fixed-income losers. Although the finance literature extensively discusses the sources of momentum in an equity universe, the specific explanations for momentum in government bonds are rather scarce.

This paper aims to contribute in two ways. First, we provide new evidence on the momentum effect in international government bond markets. Using cross-sectional and time-series tests, we investigate a sample of government bonds from 22 countries for the years 1980 through 2018.

Second, and more importantly, we offer and test two new explanations of momentum. Our first hypothesis builds on Conrad and Kaul (1998): we conjecture that the momentum in bonds may simply capture the cross-sectional variation in long-run returns. In other words, the top performing assets continue to deliver higher returns because they exhibit excessive risk exposure. In particular, we assume that the winner (loser) bonds may display high (low) exposure to duration and credit risks, which drive the excessive long-run returns. The second hypothesis is that the momentum in bonds might be driven by the returns on underlying currencies.

Fund flows

The primary findings of this study can be summarized as follows. We document a strong and robust momentum effect in government bonds. An equal-weighted portfolio of past winners tends to outperform past losers by 0.24–0.35% per month. The effect is not fully attributable to the risk factors in government bonds, which explain 38–55% of the abnormal profits. Nevertheless, the phenomenon is entirely explained by the momentum in underlying foreign exchange rates, which is consistent with our second hypothesis. Once we control for the currency returns in cross-section or time-series tests, the momentum alphas disappear. The results are robust to many considerations, including alternative sorting periods and portfolio implementation methods, as well as subperiod and subsample analyses."


Are you looking for more strategies to read about? Check http://\/\/new-fmhwbzh6ghd9hede.swedencentral-01.azurewebsites.net/Screener

Do you want to see performance of trading systems we described? Check http://\/\/new-fmhwbzh6ghd9hede.swedencentral-01.azurewebsites.net/Chart/Performance

Do you want to know more about us? Check http://\/\/new-fmhwbzh6ghd9hede.swedencentral-01.azurewebsites.net/Home/About


Follow us on:

Facebook: https://www.facebook.com/quantpedia/

Twitter: https://twitter.com/quantpedia


Continue reading »

Three Insights from Academic Research Related to Momentum Strategy

What are the main insights?

– momentum is not an anomaly in a risk-based asset pricing framework. Riskier assets tend to be in the loser portfolios after (large) increases in the price of risk. The risk of momentum portfolios usually decreases with the prevailing price of risk, and their risk premiums are approximately negative quadratic functions of the price of risk (and the market premium) theoretically truncated at zero.

– changes to market liquidity adds to the explanation of momentum crashes along with the market rebounds, this relationship is driven by the asymmetric large return sensitivity of short-leg of momentum portfolio to changes in market liquidity that flares the tail risk of momentum strategy in panic states

– momentum returns are highly related to market risk arising from return dispersion (RD) as momentum risk loadings and RD risk loadings are similarly priced in momentum portfolios

1/

Author: Souza

Title: A Critique of Momentum Anomalies

Link: https://papers.ssrn.com/sol3/papers.cfm?abstract_id=3341275

Abstract:

This paper offers theoretical, empirical, and simulated evidence that momentum regularities in asset prices are not anomalies. Within a general, frictionless, rational expectations, risk-based asset pricing framework, riskier assets tend to be in the loser portfolios after (large) increases in the price of risk. Hence, the risk of momentum portfolios usually decreases with the prevailing price of risk, and their risk premiums are approximately negative quadratic functions of the price of risk (and the market premium) theoretically truncated at zero. The best linear (CAPM) function describing this relation unconditionally has exactly the negative slope and positive intercept documented empirically.

2/

Authors: Butt, Virk

Title: Momentum Crashes and Variations to Market Liquidity

Link: https://papers.ssrn.com/sol3/papers.cfm?abstract_id=3314095

Abstract:

We document that the variation in market liquidity is an important determinant of momentum crashes that is independent of other known explanations surfaced on this topic. This relationship is driven by the asymmetric large return sensitivity of short-leg of momentum portfolio to changes in market liquidity that flares the tail risk of momentum strategy in panic states. This identification explains the forecasting ability of known predictors of tail risk of momentum strategy such that the contemporaneous increase in market liquidity predominantly sums up the trademark negative relationship between predictors and future momentum returns. Our results are robust using a different momentum portfolio and alternative measures of market liquidity that make a substantial part of the common source of variation in aggregate liquidity.

3/

Authors: Kolari, Liu

Title: Market Risk and the Momentum Mystery

Link: https://papers.ssrn.com/sol3/papers.cfm?abstract_id=3280559

Abstract:

This paper employs the ZCAPM asset pricing model of Liu, Kolari, and Huang (2018) to show that momentum returns are highly related to market risk arising from return dispersion (RD). Cross-sectional tests show that momentum risk loadings and RD risk loadings are similarly priced in momentum portfolios. Comparative analyses find that zero-investment momentum portfolios and zero-investment return dispersion portfolios earn high returns relative to other risk factors. Further regression tests indicate that zero-investment momentum returns are very significantly related to zero-investment return dispersion returns. We conclude that the momentum mystery is explained by market risk associated with return dispersion for the most part.


Are you looking for more strategies to read about? Check http://\/\/new-fmhwbzh6ghd9hede.swedencentral-01.azurewebsites.net/Screener

Do you want to see performance of trading systems we described? Check http://\/\/new-fmhwbzh6ghd9hede.swedencentral-01.azurewebsites.net/Chart/Performance

Do you want to know more about us? Check http://\/\/new-fmhwbzh6ghd9hede.swedencentral-01.azurewebsites.net/Home/About


Follow us on:

Facebook: https://www.facebook.com/quantpedia/

Twitter: https://twitter.com/quantpedia


Continue reading »

Two Centuries of Global Factor Premiums

Related to all major factor strategies (trend, momentum, value, carry, seasonality and low beta/volatility):

Authors: Baltussen, Swinkels, van Vliet

Title: Global Factor Premiums

Link: https://papers.ssrn.com/sol3/papers.cfm?abstract_id=3325720

Abstract:

We examine 24 global factor premiums across the main asset classes via replication and new-sample evidence spanning more than 200 years of data. Replication yields ambiguous evidence within a unified testing framework with methods that account for p-hacking. The new-sample evidence reveals that the large majority of global factors are strongly present under conservative p-hacking perspectives, with limited out-of-sample decay of the premiums. Further, utilizing our deep sample, we find global factor premiums to be not driven by market, downside, or macroeconomic risks. These results reveal strong global factor premiums that present a challenge to asset pricing theories.

Notable quotations from the academic research paper:

"In this paper we study global factors premiums over a long and wide sample spanning the recent 217 years across equity index (but not single securities), bond, currency, and commodity markets.

The first objective of this study is to robustly and rigorously examine these global factor premiums from the perspective of ‘p-hacking’.

We take as our starting point the main global return factors published in the Journal of Finance and the Journal of Financial Economics during the period 2012-2018: time-series momentum (henceforth ‘trend’), cross-sectional momentum (henceforth ‘momentum’), value, carry, return seasonality and betting-against-beta (henceforth ‘BAB’). We examine these global factors in four major asset classes: equity indices, government bonds, commodities and currencies, hence resulting in a total of 24 global return factors.4

We work from the idea that these published factor premiums could be influenced by p-hacking and that an extended sample period is useful for falsification or verification tests. Figure 1, Panel A summarizes the main results of these studies.

Global factor strategies

Shown are the reported Sharpe ratio’s in previous publications, as well as the 5% significance cutoff in the grey-colored dashed line. In general, the studies show evidence on the global factor premiums, with 14 of the 22 factors (return seasonality is not tested in bonds and currencies) displaying significant Sharpe ratio’s at the conventional 5% significance level.

Global factor strategies 1981-20111

Further, most of the studies have differences in, amongst others, testing methodologies, investment universes and sample periods, choices that introduce degrees of freedom to the researcher. To mitigate the impact of such degrees of freedom, we reexamine the global return factors using uniform choices on testing methodology and investment universe over their average sample period (1981-2011). Figure 1, Panel B shows the results of this replicating exercise. We find that Sharpe ratios are marginally lower, with 12 of the 24 factor premiums being significant at the conventional 5% level.

Global factor strategies 1981-2011


The second objective of this study is to provide rigorous new sample evidence on the global return factors. To this end, we construct a deep, largely uncovered historical global database on the global return factors in the four major asset classes. This data consists of pre-sample data spanning the period 1800- 1980, supplemented with post-sample data from 2012-2016, such that we have an extensive new sample to conduct further analyses. If the global return factors were unintentionally the result of p-hacking, we would expect them to disappear for this new sample period.

Our new sample findings reveal consistent and ubiquitous evidence for the large majority of global return factors. Figure 1, Panel C summarizes our main findings by depicting the historical Sharpe ratio’s in the new sample period. In terms of economic significance, the Sharpe ratios are substantial, with an average of 0.41. Remarkably, in contrast to most out-of-sample studies we see very limited ‘out-of-sample’ decay of factor premiums.

In terms of statistical significance and p-hacking perspectives, 19 of the 24 t-values are above 3.0,19 Bayesian p-values are below 5%, and the break-even prior odds generally need to be above 9,999 to have less than 5% probability that the null hypothesis is true."


Are you looking for more strategies to read about? Check http://\/\/new-fmhwbzh6ghd9hede.swedencentral-01.azurewebsites.net/Screener

Do you want to see performance of trading systems we described? Check http://\/\/new-fmhwbzh6ghd9hede.swedencentral-01.azurewebsites.net/Chart/Performance

Do you want to know more about us? Check http://\/\/new-fmhwbzh6ghd9hede.swedencentral-01.azurewebsites.net/Home/About


Follow us on:

Facebook: https://www.facebook.com/quantpedia/

Twitter: https://twitter.com/quantpedia


Continue reading »

Currency Hedging with Currency Risk Factors

A new research paper related to multiple currency risk factors:

#5 – FX Carry Trade
#129 – Dollar Carry Trade

Authors: Opie, Riddiough

Title: Global Currency Hedging with Common Risk Factors

Link: https://papers.ssrn.com/sol3/papers.cfm?abstract_id=3264531

Abstract:

We propose a novel method for dynamically hedging foreign exchange exposure in international equity and bond portfolios. The method exploits time-series predictability in currency returns that we find emerges from a forecastable component in currency factor returns. The hedging strategy outperforms leading alternative approaches out-of-sample across a large set of performance metrics. Moreover, we find that exploiting the predictability of currency returns via an independent currency portfolio delivers a high risk-adjusted return and provides superior diversification gains to global equity and bond investors relative to currency carry, value, and momentum investment strategies.

Notable quotations from the academic research paper:

"How should global investors manage their foreign exchange (FX) exposure? The classical approach to currency hedging via mean-variance optimization is theoretically appealing and encompasses both risk management and speculative hedging demands. However, this approach, when applied out of sample, suff ers from acute estimation error in currency return forecasts, which leads to poor hedging performance.

In this paper we devise a novel method for dynamically hedging FX exposure using mean-variance optimization, in which we predict currency returns using common currency risk factors.

Recent breakthroughs in international macro- nance have documented that the cross-section of currency returns can be explained as compensation for risk, in a linear two-factor model that includes dollar and carry currency factors. The dollar factor corresponds to the average return of a portfolio of currencies against the U.S. dollar, while the carry factor corresponds to the returns on the currency carry trade.

We take the perspective of a mean-variance U.S. investor who can invest in a portfolio of `G10' developed economies. We adopt the standard assumption that the investor has a predetermined long position in either foreign equities or bonds and desires to optimally manage the FX exposure using forward contracts. We form estimates of currency returns using a conditional version of the two-factor model where both factor returns and factor betas are time-varying.

A related literature provides strong empirical evidence, with underpinning theoretical support, that the dollar and carry factor returns are partly predictable. We exploit this predictability to forecast currency returns. Speci ffically, we estimate factor betas and 1-month ahead dollar and carry factor returns in the time series, and then form expected bilateral currency returns using these estimates. This vector of expected currency returns enters the mean-variance optimizer to produce optimal, currency-speci fic, hedge positions. We update the positions monthly and refer to the approach as Dynamic Currency Factor (DCF) hedging.

currency hedging

We evaluate the performance of DCF hedging, over a 20-year out-of-sample period, against nine leading alternative approaches ranging from naive solutions in which FX exposure is either fully hedged or never hedged, through to the most sophisticated techniques that also adopt mean-variance optimization. We nd DCF hedging generates systematically superior out-of-sample performance compared to all alternative approaches across a range of statistical and economic performance measures for both international equity and bond portfolios. As a preview, in Figure 2 we show the cumulative payoff to a $1 investment in international equity and bond portfolios in January 1997. When adopting DCF hedging, the $1 investment grows to over $5 by July 2017 for the global equity portfolio, and to almost $4 for the global bond portfolio. These values contrast with $2 and $1.5, which a U.S. investor would have obtained, if the FX exposure in the equity or bond portfolios was left unhedged."


Are you looking for more strategies to read about? Check http://\/\/new-fmhwbzh6ghd9hede.swedencentral-01.azurewebsites.net/Screener

Do you want to see an overview of our database of trading strategies? Check https://\/\/new-fmhwbzh6ghd9hede.swedencentral-01.azurewebsites.net/Chart

Do you want to know how we are searching new strategies? Check https://\/\/new-fmhwbzh6ghd9hede.swedencentral-01.azurewebsites.net/Home/How

Do you want to know more about us? Check http://\/\/new-fmhwbzh6ghd9hede.swedencentral-01.azurewebsites.net/Home/About


Follow us on:

Facebook: https://www.facebook.com/quantpedia/

Twitter: https://twitter.com/quantpedia

Continue reading »
QuantPedia
Privacy Overview

This website uses cookies so that we can provide you with the best user experience possible. Cookie information is stored in your browser and performs functions such as recognising you when you return to our website and helping our team to understand which sections of the website you find most interesting and useful.