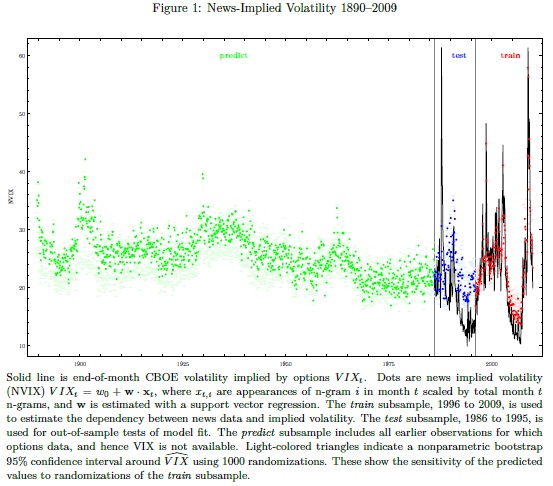
News Implied VIX Since The Year 1890

We present an interesting academic paper with a methodology that allows estimating VIX (volatility risk) since the year 1890 …

Authors: Manela, Moreira

Title: News Implied Volatility and Disaster Concerns

Link: https://papers.ssrn.com/sol3/papers.cfm?abstract_id=2382197

Abstract:

We construct a text-based measure of uncertainty starting in 1890 using front-page articles of the Wall Street Journal. News implied volatility (NVIX) peaks during stock market crashes, times of policy-related uncertainty, world wars and financial crises. In US post-war data, periods when NVIX is high are followed by periods of above average stock returns, even after controlling for contemporaneous and forward-looking measures of stock market volatility. News coverage related to wars and government policy explains most of the time variation in risk premia our measure identifies. Over the longer 1890-2009 sample that includes the Great Depression and two world wars, high NVIX predicts high future returns in normal times, and rises just before transitions into economic disasters. The evidence is consistent with recent theories emphasizing time variation in rare disaster risk as a source of aggregate asset prices fluctuations.

Notable quotations from the academic research paper:

"This paper aims to quantify this “spirit of the times”, which after the dust settles is forgotten, and only hard data remains to describe the period. Specifically, our goal is to measure people’s perception of uncertainty about the future, and to use this measurement to investigate what types of uncertainty drive aggregate stock market risk premia.

We start from the idea that time-variation in the topics covered by the business press is a good proxy for the evolution of investors’ concerns regarding these topics.

We estimate a news-based measure of uncertainty based on the co-movement between the front-page coverage of the Wall Street Journal and options-implied volatility (VIX). We call this measure News Implied Volatility, or NVIX for short. NVIX has two useful features that allow us to further our understanding of the relationship between uncertainty and expected returns:

(i) it has a long time-series, extending back to the last decade of the nineteen century, covering periods of large economic turmoil, wars, government policy changes, and crises of various sorts;

(ii) its variation is interpretable and provides insight into the origins of risk variation.

The first feature enables us to study how compensation for risks reflected in newspaper coverage has fluctuated over time, and the second feature allows us to identify which kinds of risk were important to investors.

We rely on machine learning techniques to uncover information from this rich and unique text dataset. Specifically, we estimate the relationship between option prices and the frequency of words using Support Vector Regression. The key advantage of this method over Ordinary Least Squares is its ability to deal with a large feature space. We find that NVIX predicts VIX well out-of-sample, with a root mean squared error of 7.48 percentage points (R2 = 0.19). When we replicate our methodology with realized volatility instead of VIX, we find that it works well even as we go decades back in time, suggesting newspaper word-choice is fairly stable over this period.

News Based VIX Index

We study whether fluctuations in NVIX encode information about equity risk premia. We begin by focusing on the post-war period commonly studied in the literature for which high-quality stock market data is available. We find strong evidence that times of greater investor uncertainty are followed by times of above average stock market returns. A one standard deviation increase in NVIX predicts annualized excess returns higher by 3.3 percentage points over the next year and 2.9 percentage points annually over the next two years.

Interpretability, a key feature of the text-based approach, enables us to investigate what type of news drive the ability of NVIX to predict returns. We decompose the text into five categories plausibly related (to a varying degree) to disaster concerns: war, financial intermediation, government policy, stock markets, and natural disasters. We find that a large part of the variation in risk premia is related to wars (53%) and government policy (27%). A substantial part of the time-series variation in risk premia NVIX identifies is driven by concerns tightly related to the type of events discussed in the rare disasters literature."


Are you looking for more strategies to read about? Check http://\/\/new-fmhwbzh6ghd9hede.swedencentral-01.azurewebsites.net/Screener

Do you want to see a performance of trading systems we described? Check http://\/\/new-fmhwbzh6ghd9hede.swedencentral-01.azurewebsites.net/Chart/Performance

Do you want to know more about us? Check http://\/\/new-fmhwbzh6ghd9hede.swedencentral-01.azurewebsites.net/Home/About


Follow us on:

Facebook: https://www.facebook.com/quantpedia/

Twitter: https://twitter.com/quantpedia


Continue reading »

An Analysis of PIMCO’s Bill Gross’ Alpha

Bill Gross is probably the most known fixed income fund manager. A new academic paper sheds more light on his track record and sources of his stellar performance …

Authors: Dewey, Brown

Title: Bill Gross' Alpha: The King Versus the Oracle

Link: https://papers.ssrn.com/sol3/papers.cfm?abstract_id=3345604

Abstract:

We set out to investigate whether ''Bond King" Bill Gross demonstrated alpha (excess average return after adjusting for market exposures) over his career, in the spirit of earlier papers asking the same question of ''Oracle of Omaha," Warren Buffett. The journey turned out to be more interesting than the destination. We do find, contrary to previous research, that Gross demonstrated alpha at conventional levels of statistical significance. But we also find that result depends less on the historical record than on whether we take the perspective of academics interested in market efficiency, investors picking a fund or someone (say a potential employer) asking whether a manager has skill or is throwing darts to pick positions. These are often thought to be overlapping or even identical questions. That's not completely unreasonable in equity markets, but in fixed income these are distinct. We also find quantitative differences, mainly that fixed-income securities have much higher correlations with each other than equities, make alpha 4.5 times as hard to measure for Gross than Buffett. We don't think our results will have much practical effect on attitudes toward Gross as an investor, but we hope they will advance understanding of what alpha means and appropriate ways to estimate it.

Notable quotations from the academic research paper:

"Superstar bond portfolio manager Bill Gross announced his retirement last week. From 1987 to 2014, his PIMCO Total Return fund generated 1.33% per year of alpha versus the Barclays US Credit index, with a t-statistic of 3.76. For many years his fund was the largest bond fund in the world, and was generally considered to be the most successful. This track record inspired us to take a closer quantitative look along the lines of Frazzini, Kabiller and Pedersen's Buff ett's Alpha (FKP). Gross, like Bu ffett, often publicly discussed what he perceives as the drivers of his returns. At the Morningstar Conference in 2014 and in a 2005 paper titled "Consistent Alpha Generation Through Structure" Gross highlighted three factors behind his returns: more credit risk than his benchmark, more 5-year and less 30-year exposure, and long mortgages and other securities with negative convexity.

We present five main fi ndings:

1. We con firm that those three factors, plus one for the general level of interest rates, explain 89% of the variance in Gross' monthly return over the 27-year period. We further estimate that Gross outperformed a passive factor portfolio by 0.84% per year, which is signi ficant at the 5% level. Gross' compounded annual return over the period was 7.52%, versus 6.44% for the Barclay's Aggregate US Index. So we find that most of his 1.08% annual outperformance of the index was alpha.

Bill Gross' Alpha

2. The FKP paper mentioned above considered one of the best-known track records in the equity asset class, Warren Buff ett's. We compliment this work by examining one of the best-known track records in the fixed-income asset class. Fixed-income investing o ffers a di erent set of challenges and opportunities than equity. We o ffer a novel discussion on the concept of manager alpha including important qualitative and quantitative di fferences in the concept of alpha with Gross versus Bu ffett.

3. The main qualitative di fference is that Gross exploited well known sources of risk and potentially excess return in the fixed-income market, exposures that investors rationally demand additional yield to accept. Bu ffett's performance, for the most part, correlates with factors uncovered long after he began investing and were still not accepted as fully as factors like credit risk or mortgage prepayment risk. Moreover Buff ett's factors probably result from behavioral biases and institutional constraints rather than rational investor preferences.

4. The main statistical di fference is the much higher r2 value in Gross' regression versus Buff ett's (about 0.9 versus 0.3) makes the alpha signi ficance estimate 4.5 times as sensitive to the observed returns on the factor portfolios. Since it is nearly impossible to estimate expected returns – there is considerable debate about the level of the equity premium even with 150 years or more of data – this makes it important to select factors that conform as closely as possible to what Gross actually did, rather than factors that merely have a high return correlation to Gross' results. The closer the factors conform to Gross' practice, the better the chance that any deviations in factor performance from expectation over the period are reflected equally in both Gross' actual results and the factor portfolio results.

5. Gross earned essentially all of his alpha in favorable markets for his factors and had a signi ficantly negative timing ability in the sense that his factor exposures were greater in months the factor had negative returns than in months the factor had positive return. This latter feature could be unfortunate timing decisions or negative convexity in the factor exposures. We discuss whether this can shed light on the source of Gross' alpha, speci fically whether it relates to preferential access to new issues and leverage."


Are you looking for more strategies to read about? Check http://\/\/new-fmhwbzh6ghd9hede.swedencentral-01.azurewebsites.net/Screener

Do you want to see performance of trading systems we described? Check http://\/\/new-fmhwbzh6ghd9hede.swedencentral-01.azurewebsites.net/Chart/Performance

Do you want to know more about us? Check http://\/\/new-fmhwbzh6ghd9hede.swedencentral-01.azurewebsites.net/Home/About


Follow us on:

Facebook: https://www.facebook.com/quantpedia/

Twitter: https://twitter.com/quantpedia


Continue reading »

Case Study: Quantpedia’s Composite Seasonal / Calendar Strategy

Despite the fact that the economic theory states that financial markets are efficient and investors are rational, a large amount of research is about anomalies, where the result is different from the theoretical expectation. At Quantpedia, we deal with anomalies in the financial markets and we have identified more than 500 attractive trading systems together with hundreds of related academic papers.

This article should be a case study of some strategies that are listed in our Screener, with an aim to present a possible usage of strategies in our database. Moreover, we have extended the backtesting period and we show that the strategies are still working and have not diminished. This blog also should serve as a case study how to use the Quantpedia’s database itself; therefore the choice of strategies was not obviously random and strategies were filtered by given criteria, however, every strategy is listed in the “free“ section, and therefore no subscription is needed.

Continue reading »

Momentum In International Government Bonds Can Be Explained By Currency Momentum

A new academic paper related to:

#8 – Currency Momentum Factor

Authors: Zaremba, Kambouris

Title: The Sources of Momentum in International Government Bond Returns

Link: https://papers.ssrn.com/sol3/papers.cfm?abstract_id=3332942

Abstract:

This study aims to offer a new explanation for the momentum effect in international government bonds. Using cross-sectional and time-series tests, we examine a sample of bonds from 22 countries for the years 1980 through 2018. We document significant momentum profits that are not attributable to bond-specific risk factors, such as volatility or credit risk. The global bond momentum is driven by the returns on underlying foreign exchange rates. Controlling for currency movements fully explains the abnormal returns on momentum strategies in international government bonds. The results are robust to many considerations including alternative sorting periods, portfolio construction methods, as well as subperiod and subsample analysis.

Notable quotations from the academic research paper:

"The various types of momentum effects have also been documented in government bonds, implying that the fixed-income winners outperform fixed-income losers. Although the finance literature extensively discusses the sources of momentum in an equity universe, the specific explanations for momentum in government bonds are rather scarce.

This paper aims to contribute in two ways. First, we provide new evidence on the momentum effect in international government bond markets. Using cross-sectional and time-series tests, we investigate a sample of government bonds from 22 countries for the years 1980 through 2018.

Second, and more importantly, we offer and test two new explanations of momentum. Our first hypothesis builds on Conrad and Kaul (1998): we conjecture that the momentum in bonds may simply capture the cross-sectional variation in long-run returns. In other words, the top performing assets continue to deliver higher returns because they exhibit excessive risk exposure. In particular, we assume that the winner (loser) bonds may display high (low) exposure to duration and credit risks, which drive the excessive long-run returns. The second hypothesis is that the momentum in bonds might be driven by the returns on underlying currencies.

Fund flows

The primary findings of this study can be summarized as follows. We document a strong and robust momentum effect in government bonds. An equal-weighted portfolio of past winners tends to outperform past losers by 0.24–0.35% per month. The effect is not fully attributable to the risk factors in government bonds, which explain 38–55% of the abnormal profits. Nevertheless, the phenomenon is entirely explained by the momentum in underlying foreign exchange rates, which is consistent with our second hypothesis. Once we control for the currency returns in cross-section or time-series tests, the momentum alphas disappear. The results are robust to many considerations, including alternative sorting periods and portfolio implementation methods, as well as subperiod and subsample analyses."


Are you looking for more strategies to read about? Check http://\/\/new-fmhwbzh6ghd9hede.swedencentral-01.azurewebsites.net/Screener

Do you want to see performance of trading systems we described? Check http://\/\/new-fmhwbzh6ghd9hede.swedencentral-01.azurewebsites.net/Chart/Performance

Do you want to know more about us? Check http://\/\/new-fmhwbzh6ghd9hede.swedencentral-01.azurewebsites.net/Home/About


Follow us on:

Facebook: https://www.facebook.com/quantpedia/

Twitter: https://twitter.com/quantpedia


Continue reading »

Can We Explain Abudance of Equity Factors Just by Data Mining? Surely Not.

Academic research has documented several hundreds of factors that explain expected stock returns. Now, question is: Are all this factors product of data mining? Recent paper by Andrew Chen runs a numerical simulation that shows that it is implausible, that abudance of equity factors can be explained solely by p-hacking …

Author: Chen

Title: The Limits of P-Hacking: A Thought Experiment

Link: https://papers.ssrn.com/sol3/papers.cfm?abstract_id=3358905

Abstract:

Suppose that asset pricing factors are just p-hacked noise. How much p-hacking is required to produce the 300 factors documented by academics? I show that, if 10,000 academics generate 1 factor every minute, it takes 15 million years of p-hacking. This absurd conclusion comes from applying the p-hacking theory to published data. To fit the fat right tail of published t-stats, the p-hacking theory requires that the probability of publishing t-stats < 6.0 is infinitesimal. Thus it takes a ridiculous amount of p-hacking to publish a single t-stat. These results show that p-hacking alone cannot explain the factor zoo.

Notable quotations from the academic research paper:

"Academics have documented more than 300 factors that explain expected stock returns. This enormous set of factors begs for an economic explanation, yet there is little consensus on their origin. A p-hacking (a.k.a. data snooping, data-mining) offers a neat and plausible solution. This cynical explanation begins by noting that the cross-sectional literature uses statistical tests that are only valid under the assumptions of classical single hypothesis testing. These assumptions are clearly violated in practice, as each published factor is drawn from multiple unpublished tests. In this well-known explanation, the factor zoo consists of factors that performed well by pure chance.

In this short paper, I follow the p-hacking explanation to its logical conclusion. To rigorously pursue the p-hacking theory, I write down a statistical model in which factors have no explanatory power, but published t-stats are large because the probability of publishing a t-stat ti follows an increasing function p(ti). I estimate p(ti ) by fitting the model to the distribution of published t-stats inHarvey, Liu, and Zhu (2016) and Chen and Zimmermann (2018). The p-hacking story is powerful: The model fits either dataset very well.

p-hacking model

Though p-hacking fits the data, following its logic further leads to absurd conclusions. In particular, the pure p-hacking model predicts that the ratio of unpublished factors to published factors is ridiculously large, at about 100 trillion to 1. To put this number in perspective, suppose that 10,000 economists mine the data for 8 hours per day, 365 days per year. And suppose that each economist finds 1 predictor every minute. Even with this intense p-hacking, it would take 15 million years to find the 316 factors in theHarvey, Liu, and Zhu (2016) dataset.

This thought experiment demonstrates that assigning the entire factor zoo to p-hacking is wrong. Though the p-hacking story appears logical, following its logic rigorously leads to implausible conclusions, disproving the theory by contradiction. Thus, my thought experiment supports the idea that publication bias in the cross-section of stock returns is relatively minor."


Are you looking for more strategies to read about? Check http://\/\/new-fmhwbzh6ghd9hede.swedencentral-01.azurewebsites.net/Screener

Do you want to see performance of trading systems we described? Check http://\/\/new-fmhwbzh6ghd9hede.swedencentral-01.azurewebsites.net/Chart/Performance

Do you want to know more about us? Check http://\/\/new-fmhwbzh6ghd9hede.swedencentral-01.azurewebsites.net/Home/About


Follow us on:

Facebook: https://www.facebook.com/quantpedia/

Twitter: https://twitter.com/quantpedia


Continue reading »

Better Rebalancing Strategy for Static Asset Allocation Strategies

An interesting financial academic paper which analyzes an alternative approach to rebalancing of static asset allocation strategies:

Authors: Granger, Harvey, Rattray, Van Hemert

Title: Strategic Rebalancing

Link: https://papers.ssrn.com/sol3/papers.cfm?abstract_id=3330134

Abstract:

A mechanical rebalancing strategy, such as a monthly or quarterly reallocation towards fixed portfolio weights, is an active strategy. Winning asset classes are sold and losers are bought. During crises, when markets are often trending, this can lead to substantially larger drawdowns than a buy-and-hold strategy. Our paper shows that the negative convexity induced by rebalancing can be substantially mitigated, taking the popular 60-40 stock-bond portfolio as our use case. One alternative is an allocation to a trend-following strategy. The positive convexity of this overlay tends to counter the impact on drawdowns of the mechanical rebalancing strategy. The second alternative we call strategic rebalancing, which uses smart rebalancing timing based on trend-following signals – without a direct allocation to a trend-following strategy. For example, if the trend-following model suggests that stock markets are in a negative trend, rebalancing is delayed.

Notable quotations from the academic research paper:

"A pure buy-and-hold portfolio has the drawback that the asset mix tends to drift over time and, as such, is untenable for investors who seek diversification. However, a stock-bond portfolio that regularly rebalances tends to underperform a buy-and-hold portfolio at times of continued outperformance of one of the assets. Using a simple two-period model, we explain the main intuition behind this effect: rebalancing means selling (relative) winners, and if winners continue to outperform, that detracts from performance.

As stocks typically have more volatile returns than bonds, relative returns tend to be driven by stocks. Hence, of particular interest are episodes with continued negative (absolute and relative) stock performance, such as the 2007-2009 global financial crisis. In Figure 2, we contrast the monthly-rebalanced and buy-and-hold cumulative performance over the financial crisis period, where both start with an initial 60-40 stock-bond capital allocation. The maximum drawdown of the monthly-rebalanced portfolio is 1.2 times (or 5 percentage points) worse than that of the buy-and-hold portfolio, right at the time when financial markets turmoil is greatest.

Rebalanced and not rebalanced portfolio

In earlier work, Granger et al. (2014) formally show that rebalancing is similar to starting with a buy-and-hold portfolio and adding a short straddle (selling both a call and a put option) on the relative value of the portfolio assets. The option-like payoff to rebalancing induces negative convexity by magnifying drawdowns when there are pronounced divergences in asset returns. We show that time-series momentum (or trend) strategies, applied to futures on the same stock and bond markets, are natural complements to a rebalanced portfolio. This is because the trend payoff tends to mimic that of a long straddle option position, or exhibits positive convexity.

Trend exposure and portfolio drawdown

We evaluate how 1-, 3-, and 12-month trend strategies perform during the five worst drawdowns for the 60-40 stock-bond portfolio. Allocating 10% to a trend strategy and 90% to a 60-40 monthly-rebalanced portfolio improves the average drawdown by about 5 percentage points, compared to a 100% allocation to a 60-40 monthly rebalanced portfolio. The trend allocation has no adverse impact on the average return over our sample period. That is, while one would normally expect a drag on the overall (long-term) performance when allocating to a defensive strategy, in our sample, the trend-following premium earned offsets the cost (or insurance premium) paid.

An alternative to a trend allocation is strategically timing and sizing rebalancing trades, which we label strategic rebalancing. We first consider a range of popular heuristic rules, varying the rebalancing frequency, using thresholds, and trading only partially back to the 60-40 asset mix. Such heuristic rules reduce the average maximum drawdown level for the five crises considered by up to 1 percentage point. However, using strategic rebalancing rules based on either the past stock or past stock-bond relative returns gives improvements of 2 to 3 percentage points."


Are you looking for more strategies to read about? Check http://\/\/new-fmhwbzh6ghd9hede.swedencentral-01.azurewebsites.net/Screener

Do you want to see performance of trading systems we described? Check http://\/\/new-fmhwbzh6ghd9hede.swedencentral-01.azurewebsites.net/Chart/Performance

Do you want to know more about us? Check http://\/\/new-fmhwbzh6ghd9hede.swedencentral-01.azurewebsites.net/Home/About


Follow us on:

Facebook: https://www.facebook.com/quantpedia/

Twitter: https://twitter.com/quantpedia


Continue reading »

Why Is Allocation to Trend-Following Strategy So Low?

Related to all trendfollowing strategies:

Authors: Dugan, Greyserman

Title: Skew and Trend Aversion

Link: https://papers.ssrn.com/sol3/papers.cfm?abstract_id=3315719

Abstract:

Despite evidence of the benefits to portfolio Sharpe ratio and variance, actual investor allocations to Trend Following strategies are typically 5% or less. Why is there such a significant discrepancy between the optimal allocation and actual allocation to Trend? We investigate known behavioral biases as a potential reason. While decision makers have other reasons to exclude Trend Following from their portfolios, in this paper, we explore loss aversion, recency bias, and the ambiguity effect as they pertain to Trend Following, and we call the combination of the three Trend Aversion. We quantify Trend Aversion and show that these biases are a viable explanation for suboptimal allocations to Trend. We demonstrate a direct connection between quantifications of known behavioral biases and current suboptimal allocations to Trend Following. Recognition of these relationships will help highlight the pitfalls of behavioral biases.

Notable quotations from the academic research paper:

"Investors may have reasons for excluding Trend Following from their portfolios ranging from time-horizon for performance, to drawdowns, to potential capacity issues. However, the strategy's long performance history shows that a meaningful allocation would have increased portfolio Sharpe ratio and reduced portfolio variance, and yet typical investments remain at or below 5%. Some investors have no exposure.

The strategy's quantitative nature, positive skew, and frequent but small losses act in concert to trigger loss aversion, recency bias, and the ambiguity e ffect. We call the combination of the three Trend Aversion.

Sharpe ratio vs. Fraction invested in Trend


Our results show Trend Aversion is a viable explanation of suboptimal allocations to Trend Following. Decades of psychological research show that people mentally inflate losses by a factor of two. In this paper, we demonstrated that a loss multiplier between 1.5 and 2.5 would cause the typical allocation to Trend of 5% in a simple two asset portfolio, in an 11-asset portfolio with random allocations, and in two other 11-asset portfolio constructions with dynamic allocations. We showed that loss aversion can decrease allocators Sharpe ratios by up to 50%. Using lookback windows in a dynamically allocated portfolio, we demonstrated that recency bias drives down allocations to Trend. Finally, we showed that combinations of loss aversion and recency bias also drive Trend allocations to suboptimal levels.

Many investors who are subject to Trend Aversion as a practical matter, for example due to investment committees or reporting structures, are unsure of how to balance Trend Aversion with the bene ts of Trend Following to reach an allocation decision. By establishing a methodology to optimize allocations under loss aversion, we provide a framework which investors can use to formalize their allocation decisions. Investors who are subject to typical loss aversion should permanently allocate at least 5% to Trend Following, while investors whose loss aversion is lower can benefi t substantially by allocating materially more than 5%."


Are you looking for more strategies to read about? Check http://\/\/new-fmhwbzh6ghd9hede.swedencentral-01.azurewebsites.net/Screener

Do you want to see performance of trading systems we described? Check http://\/\/new-fmhwbzh6ghd9hede.swedencentral-01.azurewebsites.net/Chart/Performance

Do you want to know more about us? Check http://\/\/new-fmhwbzh6ghd9hede.swedencentral-01.azurewebsites.net/Home/About


Follow us on:

Facebook: https://www.facebook.com/quantpedia/

Twitter: https://twitter.com/quantpedia


Continue reading »

Currency Hedging with Currency Risk Factors

A new research paper related to multiple currency risk factors:

#5 – FX Carry Trade
#129 – Dollar Carry Trade

Authors: Opie, Riddiough

Title: Global Currency Hedging with Common Risk Factors

Link: https://papers.ssrn.com/sol3/papers.cfm?abstract_id=3264531

Abstract:

We propose a novel method for dynamically hedging foreign exchange exposure in international equity and bond portfolios. The method exploits time-series predictability in currency returns that we find emerges from a forecastable component in currency factor returns. The hedging strategy outperforms leading alternative approaches out-of-sample across a large set of performance metrics. Moreover, we find that exploiting the predictability of currency returns via an independent currency portfolio delivers a high risk-adjusted return and provides superior diversification gains to global equity and bond investors relative to currency carry, value, and momentum investment strategies.

Notable quotations from the academic research paper:

"How should global investors manage their foreign exchange (FX) exposure? The classical approach to currency hedging via mean-variance optimization is theoretically appealing and encompasses both risk management and speculative hedging demands. However, this approach, when applied out of sample, suff ers from acute estimation error in currency return forecasts, which leads to poor hedging performance.

In this paper we devise a novel method for dynamically hedging FX exposure using mean-variance optimization, in which we predict currency returns using common currency risk factors.

Recent breakthroughs in international macro- nance have documented that the cross-section of currency returns can be explained as compensation for risk, in a linear two-factor model that includes dollar and carry currency factors. The dollar factor corresponds to the average return of a portfolio of currencies against the U.S. dollar, while the carry factor corresponds to the returns on the currency carry trade.

We take the perspective of a mean-variance U.S. investor who can invest in a portfolio of `G10' developed economies. We adopt the standard assumption that the investor has a predetermined long position in either foreign equities or bonds and desires to optimally manage the FX exposure using forward contracts. We form estimates of currency returns using a conditional version of the two-factor model where both factor returns and factor betas are time-varying.

A related literature provides strong empirical evidence, with underpinning theoretical support, that the dollar and carry factor returns are partly predictable. We exploit this predictability to forecast currency returns. Speci ffically, we estimate factor betas and 1-month ahead dollar and carry factor returns in the time series, and then form expected bilateral currency returns using these estimates. This vector of expected currency returns enters the mean-variance optimizer to produce optimal, currency-speci fic, hedge positions. We update the positions monthly and refer to the approach as Dynamic Currency Factor (DCF) hedging.

currency hedging

We evaluate the performance of DCF hedging, over a 20-year out-of-sample period, against nine leading alternative approaches ranging from naive solutions in which FX exposure is either fully hedged or never hedged, through to the most sophisticated techniques that also adopt mean-variance optimization. We nd DCF hedging generates systematically superior out-of-sample performance compared to all alternative approaches across a range of statistical and economic performance measures for both international equity and bond portfolios. As a preview, in Figure 2 we show the cumulative payoff to a $1 investment in international equity and bond portfolios in January 1997. When adopting DCF hedging, the $1 investment grows to over $5 by July 2017 for the global equity portfolio, and to almost $4 for the global bond portfolio. These values contrast with $2 and $1.5, which a U.S. investor would have obtained, if the FX exposure in the equity or bond portfolios was left unhedged."


Are you looking for more strategies to read about? Check http://\/\/new-fmhwbzh6ghd9hede.swedencentral-01.azurewebsites.net/Screener

Do you want to see an overview of our database of trading strategies? Check https://\/\/new-fmhwbzh6ghd9hede.swedencentral-01.azurewebsites.net/Chart

Do you want to know how we are searching new strategies? Check https://\/\/new-fmhwbzh6ghd9hede.swedencentral-01.azurewebsites.net/Home/How

Do you want to know more about us? Check http://\/\/new-fmhwbzh6ghd9hede.swedencentral-01.azurewebsites.net/Home/About


Follow us on:

Facebook: https://www.facebook.com/quantpedia/

Twitter: https://twitter.com/quantpedia

Continue reading »

ETFs Increase Correlation of International Equity Markets

Everybody can see that international equity markets are highly correlated (and especially during past 10-15 years). A new interesting financial research paper shows that ETF arbitrage mechanism is one of the key channels through which U.S. shocks propagate to local economies leading to increased return correlation with the U.S. market:

Authors: Filippou, Gozluklu, Rozental

Title: ETF Arbitrage and International Correlation

Link: https://papers.ssrn.com/sol3/papers.cfm?abstract_id=3287417

Abstract:

Assets under management of exchange-traded funds (ETF) have been growing significantly, yet the majority of ETF trades still occur on U.S. exchanges. We show that investment decisions of both institutional and retail investors when trading international country ETFs are mostly driven by shocks related to U.S. fundamentals, measured by VIX, rather than local country risks. Investors react only to negative news about local economies. When U.S. economic uncertainty increases, investors leave the country ETF market and switch to Cash ETF products. We demonstrate that ETF arbitrage mechanism is one of the key channels through which U.S. shocks propagate to local economies leading to increased return correlation with the U.S. market both in time-series and cross-sectional dimensions. We find that countries with stronger ETF price-discovery and lower limits to arbitrage tend to have a higher comovement with the U.S. market.

Notable quotations from the academic research paper:

"Signi ficant innovations in financial products made international investments increasingly possible. Over the recent years, exchange-traded funds experienced a double-digit growth in assets under management. Nevertheless, the short-run interdependence of trading across major international ETFs and its association with local and global risk aversion remain understudied. While the majority of earlier studies focuses on direct eff ects of ETFs on the underlying securities in the basket that it tracks, we examine the indirect e ffect of ETF trading as a transmission mechanism of U.S. market shocks to foreign country equity markets.

We provide a view that as the U.S. accommodates the largest share of ETF global trading volume, its market conditions directly impact the decisions of country ETF investors. We show that international ETF market participants trade based on shocks related to U.S. fundamentals rather than local ones, and propagate those shocks to local markets. The shock transmission is performed via ETF arbitrage. We argue that such arbitrage activity is one of the few mechanisms responsible for increasing correlation between the U.S. market and the rest of the world.

This high cross-country correlation limits the ability of investors to cheaply diversify U.S. risk via international ETF investments. In addition, ETFs often provide an easier access to less integrated emerging markets or to countries were direct investments are costly (e.g., Brazil). However, the transmission of U.S. shocks to those markets limits the diversi fication bene ts of emerging market strategies.

correlation

We fi rst test the hypothesis whether country ETF investors react to changes in the U.S. rather than local economic uncertainty, as measured by CBOE Volatility Index (VIX). To this end, we compute order imbalances of retail investors (e.g., Boehmer, Jones, and Zhang, 2017), and trades of di fferent size, capturing high frequency trading (HFT) and institutional trades. Focusing on a large cross-section of 41 countries, we find strong association between ETF order imbalances and U.S. VIX, indicating that international investment decisions are mainly driven by the latter measure, rather than its local counterparts. For example, an increase in the U.S. VIX results in a selling pressure in the country ETF market. Such result is robust to di fferent volatility regimes and is consistent across di fferent types of investors. Asymmetric response analysis confi rms that country ETF investors only react to positive changes in local VIX, which correspond to negative news in the local markets. Moreover, we observe that, when reacting to an increase in U.S. uncertainty, investors switch to safer assets such as cash equivalent ETFs. We also find that investors respond to changes in U.S. political uncertainty di fferently than to economic uncertainty – they leave the U.S. stock market and buy international country-level ETFs. However, they do not react to local political uncertainty and the economic eff ect of political risk is much smaller than of changes in U.S. VIX.

In order to access the impact of ETF arbitrage on correlation of country returns with the U.S. market, we regress daily innovations in such correlation on a proxy for ETF arbitrage during di fferent volatility regimes. We provide time-series evidence that during periods of high volatility in the U.S., an increase in the arbitrage activity by the authorized participant (AP) (as measured by net share creation/redemption) results in an increase in innovation in such daily correlation. We argue that during periods of high volatility in the U.S. market, it is harder for investors to distinguish between noise and fundamental component of the order flow. Consequently, based on wake-up call hypothesis investor may treat U.S. shocks as relevant to their own country and consume such shocks via ETF arbitrage.

We also explain cross-country variation in return correlation with the U.S. market. According to Ben-David, Franzoni, and Moussawi (2018), non-fundamental shocks must be reversed over time. This suggests that if all shocks transmitted from ETF market to local economies were non-fundamental, ETF arbitrage would not contribute towards increased correlation. In contrast, if the price deviation from the NAV is due to faster incorporation of fundamental information in ETF market, then arbitrage should a ffect returns of underlying index, and such e ffect should not be reverted. If such fundamental information is common both to U.S. and local market, one should observe a higher correlation between them.

Consistent with the literature, we argue that ETF transmits both fundamental and noise shocks to the underlying economies. We show that countries that have a higher degree of price discovery in their ETFs have on average a higher correlation with the U.S. market. In these markets fundamental information gets incorporated into ETF prices faster than in the Net Asset Value (NAV), and therefore, market makers closely follow and learn from changes in ETF prices. This is the case when derivative securities price the underlying assets, rather than the other way around. In addition, in order for fundamental shocks to get transmitted to underlying markets, the authorised participants (AP) must engage in arbitrage activity. We find that the lower the limits to ETF arbitrage the higher is the correlation between a country and the U.S. market. Neither the international trade channel nor the business cycles alter this result."


Are you looking for more strategies to read about? Check http://\/\/new-fmhwbzh6ghd9hede.swedencentral-01.azurewebsites.net/Screener

Do you want to see an overview of our database of trading strategies? Check https://\/\/new-fmhwbzh6ghd9hede.swedencentral-01.azurewebsites.net/Chart

Do you want to know how we are searching new strategies? Check https://\/\/new-fmhwbzh6ghd9hede.swedencentral-01.azurewebsites.net/Home/How

Do you want to know more about us? Check http://\/\/new-fmhwbzh6ghd9hede.swedencentral-01.azurewebsites.net/Home/About


Follow us on:

Facebook: https://www.facebook.com/quantpedia/

Twitter: https://twitter.com/quantpedia

Continue reading »

FOMC Equity Drift Occurs in Periods of High Uncertainty

A new research paper related mainly to:

#75 – Federal Open Market Committee Meeting Effect in Stocks

Authors: Martello, Ribeiro

Title: Pre-FOMC Announcement Relief

Link: https://papers.ssrn.com/sol3/papers.cfm?abstract_id=3286745

Abstract:

We show that the pre-FOMC announcement drift in equity returns occurs mostly in periods of high market uncertainty or risk premium. Specifically, this abnormal return is explained by a significant reduction in the risk premium (implied volatility and variance risk premium) prior to the announcement, but only when the risk premium is high, e.g., when it is above its median. Likewise, the magnitude of the FOMC Cycle and other related patterns varies with uncertainty and risk premium. Market uncertainty measures are persistent and are not related to policy uncertainty or expectations. Markets become only marginally stressed in the days prior to the announcement and changes in uncertainty appear to be of lower frequency. We also explain why recent studies suggest that the pre-FOMC drift might have disappeared in the past decade, as this moderation is due to time variation that was also present in older data. Additionally, CAPM only works on FOMC dates when the risk premium is high, e.g., implied vol above its prior median level. The results are robust to different samples and measures of risk premium and uncertainty.

Notable quotations from the academic research paper:

"We show that pre-announcement return drift is associated with significant declines in risk (premium) during times of high risk (premium). Implied volatility and the variance risk premium decrease in the hours before the announcement in an almost perfect mirror image of the increase in market prices. Moreover, we show that the magnitude of the return drift and the decline in risk depends on the level of market implied volatility, or other related variables, days or even weeks prior to the announcement.

Just to exemplify, the average pre-FOMC drift when implied volatility is above its prior median is 109 basis points (bps), while it is only 9.7 bps when it is below its median. In the bottom 20% of implied volatilities, the drift is close to zero or even negative, depending on the specification. Lucca and Moench [2015] also showed the importance of the VIX in their analysis, but here we show that this and other market uncertainty variables are actually essential for a better understanding of the pre-announcement return drift and all FOMC announcement related patterns. Figure 2 replicates a figure in Lucca and Moench [2015] that shows stock market performance around FOMC releases. Here we show that the pre-announcement drift is much stronger in periods of high risk premium and uncertainty.

We also provide clear evidence of investor relief, i.e., a decline in implied volatility or other risk measures, hours before the announcement using intraday information. Panel B of Figure 2 also shows that uncertainty is going down as a mirror image of the realized return. The magnitude of this pre-announcement investor relief also depends on the level of market uncertainty, as it tends to go down more when it is high. Considering the squared value of the VIX as our priced risk proxy, we show that, during high volatility periods, implied variance declines by 103.5 bps in anticipation of the announcement, while during low volatility periods, it rises by insignificant 0.3 bps. Hence, high volatility periods present both higher realized equity returns and greater resolution of market uncertainty hours before pre-scheduled announcements.

FOMC return patterns"


Are you looking for more strategies to read about? Check http://\/\/new-fmhwbzh6ghd9hede.swedencentral-01.azurewebsites.net/Screener

Do you want to see an overview of our database of trading strategies? Check https://\/\/new-fmhwbzh6ghd9hede.swedencentral-01.azurewebsites.net/Chart

Do you want to know how we are searching new strategies? Check https://\/\/new-fmhwbzh6ghd9hede.swedencentral-01.azurewebsites.net/Home/How

Do you want to know more about us? Check http://\/\/new-fmhwbzh6ghd9hede.swedencentral-01.azurewebsites.net/Home/About


Follow us on:

Facebook: https://www.facebook.com/quantpedia/

Twitter: https://twitter.com/quantpedia

Continue reading »
QuantPedia
Privacy Overview

This website uses cookies so that we can provide you with the best user experience possible. Cookie information is stored in your browser and performs functions such as recognising you when you return to our website and helping our team to understand which sections of the website you find most interesting and useful.