Stocks Not For the Long Run?

There are very few observations of the attributes of financial markets that are considered by most of the investors as nearly permanent facts. One of the most often cited examples is that over the long interval stocks outperform bonds. But is it really such truth? Over how long interval? 10 years, 20 years, 30 years? As the new and better historical data are becoming available for analysis, they show interesting findings. Let’s show one example. There exist one very long interval during which the return of stocks was nearly equal to bonds. What do you think is the length of such an interval in the case of the US? It’s 150 years! Yes, that’s correct, there was a one-and-half-century long period in the history of the United States when the performance of stocks and bonds was nearly identical. We do not imply that it will be the case in the 21st century. But an important research paper written by Edward McQuarrie shows that investors must prepare for even the most unexpected possibilities when they are making their asset allocation decisions.

Author: McQuarrie

Title: The US Bond Market before 1926: Investor Total Return from 1793, Comparing Federal, Municipal and Corporate Bonds Part II: 1857 to 1926

Continue reading »

Hierarchical Risk Parity

Various risk parity methodologies are a popular choice for the construction of better diversified and balanced portfolios. It is notoriously hard to predict the future performance of the majority of asset classes. Risk parity approach overcomes this shortcoming by building portfolios using only assets’ risk characteristics and correlation matrix. A new research paper written by Lohre, Rother and Schafer builds on the foundation of classical risk parity methods and presents hierarchical risk parity technique. Their method uses graph theory and machine learning to build a hierarchical structure of the investment universe. Such structure allows better division of assets into clusters with similar characteristics without relying on classical correlation analysis. These portfolios then offer better tail risk management, especially for skewed assets and style factor strategies.

Authors: Lohre, Rother and Schafer

Title: Hierarchical Risk Parity: Accounting for Tail Dependencies in Multi-Asset Multi-Factor Allocations

Continue reading »

Alternative Fair-Value Models for Currency Value Strategy

The idea of buying an investment asset for a lower price than a fair-value is the cornerstone of value factor strategies. Various value strategies were popularized by famous investor Benjamin Graham (and his successors like Warren Buffett) and were firstly employed in the stock market. This idea of looking for investment opportunities that can be bought cheaply can also be applied in currency markets – Currency Value Factor strategy. There is, however, one catch – an investor must know the fair-value exchange rate for currencies. The most popular equilibrium exchange rate model used for this purpose is based on PPP (purchasing power parity). A new research paper written by Ca’ Zorzi, Cap, Mijakovic, and Rubaszek analyzes two additional models – Behavioral Equilibrium Exchange Rate (BEER) and the Macroeconomic Balance (MB) approach to assess which model has the best forecasting power.

Authors: Ca’ Zorzi, Cap, Mijakovic, Rubaszek

Title: The Predictive Power of Equilibrium Exchange Rate Models

Continue reading »

The CAPE Ratio and Machine Learning

Professor Robert Shiller’s work and his famous CAPE (cyclically-adjusted price-to-earnings) ratio is well known among the investment community. His methodology for assessing a valuation of the U.S. equity market is not the first one but is surely the most cited and the most discussed. There are numerous papers that tweak or adjust Shiller’s methodology to assess better if U.S. equities are under- or over-valued. We recommend the work of Wang, Ahluwalia, Aliaga-Diaz, and Davis (all from The Vanguard Group ) in which they use a combination of machine learning and a regression-based approach to obtain forecasted CAPE ratio, and subsequently, U.S. stock market returns, more accurately.

Authors: Wang, Ahluwalia, Aliaga-Diaz, Davis

Title: The Best of Both Worlds: Forecasting US Equity Market Returns using a Hybrid Machine Learning – Time Series Approach

Continue reading »

Top Ten Blog Posts on Quantpedia in 2019

The end of the year is a good time for a short recapitulation. Apart from other things we do (which we will summarize in our next blog in a few days), we have published around 50 short blog posts / recherches of academic papers on this blog during the last year. We want to use this opportunity to summarize 10 of them, which were the most popular (based on Google Analytics tool). Maybe you will be able to find something you have not read yet …

Continue reading »

How to Choose the Best Period for Indicators

Academic literature recognizes a large set of indicators or factors that are connected with the various assets. These indicators can be utilized in a variety of trading strategies, which means that such indicators are popular among practitioners who seek to invest their funds. Usually, the indicators are connected with some evaluation period.

This paper aims to show some possible approaches to find the optimal evaluation periods of indicators. This is a key question among practitioners and therefore we see it as crucial to shed a light on this topic. Although we are focused on momentum strategies, the information in this paper is widely applicable also in the construction of any other trading strategy where the investor has to decide indicator’s period…

Continue reading »

Commodity Futures Risk Premium – Historical Analysis

We at Quantpedia absolutely love long-term studies, and academic research paper written by Bhardwaj, Janardanan, and Rouwenhorst is really exceptional. There are a lot of studies covering a long history of equity and bond markets. But futures markets are not covered so well, and that’s the reason why is this paper so valuable. An additional plus is that study covers also delisted contracts, which makes the study’s data quality even better. Quantpedia’s recommended read to anyone interested in asset allocation into commodities …

Authors: Bhardwaj, Janardanan and Rouwenhorst

Title: The Commodity Futures Risk Premium: 1871–2018

Continue reading »

What Affects the Correlation Between Stocks and Bonds

The correlation between bonds and stocks is essential information for asset allocation decisions; therefore understanding its macro-economic drivers is very valuable for all investors. Stocks-bonds correlation isn’t stable, as we have experienced in the last 30 years, as the correlation, which was positive until the end of the 1990s, changed sign at the turn of the century. Research paper written by Marcello Pericoli sheds more light on this issue and shows that the correlation is primarily influenced by the uncertainty about inflation and real interest rates as well as by co-movement between inflation, real interest rates and dividend growth.

Author: Pericoli

Title: Macroeconomics Determinants of the Correlation Between Stocks and Bonds

Continue reading »

Can We Explain Abudance of Equity Factors Just by Data Mining? Surely Not.

Academic research has documented several hundreds of factors that explain expected stock returns. Now, question is: Are all this factors product of data mining? Recent paper by Andrew Chen runs a numerical simulation that shows that it is implausible, that abudance of equity factors can be explained solely by p-hacking …

Author: Chen

Title: The Limits of P-Hacking: A Thought Experiment

Link: https://papers.ssrn.com/sol3/papers.cfm?abstract_id=3358905

Abstract:

Suppose that asset pricing factors are just p-hacked noise. How much p-hacking is required to produce the 300 factors documented by academics? I show that, if 10,000 academics generate 1 factor every minute, it takes 15 million years of p-hacking. This absurd conclusion comes from applying the p-hacking theory to published data. To fit the fat right tail of published t-stats, the p-hacking theory requires that the probability of publishing t-stats < 6.0 is infinitesimal. Thus it takes a ridiculous amount of p-hacking to publish a single t-stat. These results show that p-hacking alone cannot explain the factor zoo.

Notable quotations from the academic research paper:

"Academics have documented more than 300 factors that explain expected stock returns. This enormous set of factors begs for an economic explanation, yet there is little consensus on their origin. A p-hacking (a.k.a. data snooping, data-mining) offers a neat and plausible solution. This cynical explanation begins by noting that the cross-sectional literature uses statistical tests that are only valid under the assumptions of classical single hypothesis testing. These assumptions are clearly violated in practice, as each published factor is drawn from multiple unpublished tests. In this well-known explanation, the factor zoo consists of factors that performed well by pure chance.

In this short paper, I follow the p-hacking explanation to its logical conclusion. To rigorously pursue the p-hacking theory, I write down a statistical model in which factors have no explanatory power, but published t-stats are large because the probability of publishing a t-stat ti follows an increasing function p(ti). I estimate p(ti ) by fitting the model to the distribution of published t-stats inHarvey, Liu, and Zhu (2016) and Chen and Zimmermann (2018). The p-hacking story is powerful: The model fits either dataset very well.

p-hacking model

Though p-hacking fits the data, following its logic further leads to absurd conclusions. In particular, the pure p-hacking model predicts that the ratio of unpublished factors to published factors is ridiculously large, at about 100 trillion to 1. To put this number in perspective, suppose that 10,000 economists mine the data for 8 hours per day, 365 days per year. And suppose that each economist finds 1 predictor every minute. Even with this intense p-hacking, it would take 15 million years to find the 316 factors in theHarvey, Liu, and Zhu (2016) dataset.

This thought experiment demonstrates that assigning the entire factor zoo to p-hacking is wrong. Though the p-hacking story appears logical, following its logic rigorously leads to implausible conclusions, disproving the theory by contradiction. Thus, my thought experiment supports the idea that publication bias in the cross-section of stock returns is relatively minor."


Are you looking for more strategies to read about? Check http://\/\/new-fmhwbzh6ghd9hede.swedencentral-01.azurewebsites.net/Screener

Do you want to see performance of trading systems we described? Check http://\/\/new-fmhwbzh6ghd9hede.swedencentral-01.azurewebsites.net/Chart/Performance

Do you want to know more about us? Check http://\/\/new-fmhwbzh6ghd9hede.swedencentral-01.azurewebsites.net/Home/About


Follow us on:

Facebook: https://www.facebook.com/quantpedia/

Twitter: https://twitter.com/quantpedia


Continue reading »

Better Rebalancing Strategy for Static Asset Allocation Strategies

An interesting financial academic paper which analyzes an alternative approach to rebalancing of static asset allocation strategies:

Authors: Granger, Harvey, Rattray, Van Hemert

Title: Strategic Rebalancing

Link: https://papers.ssrn.com/sol3/papers.cfm?abstract_id=3330134

Abstract:

A mechanical rebalancing strategy, such as a monthly or quarterly reallocation towards fixed portfolio weights, is an active strategy. Winning asset classes are sold and losers are bought. During crises, when markets are often trending, this can lead to substantially larger drawdowns than a buy-and-hold strategy. Our paper shows that the negative convexity induced by rebalancing can be substantially mitigated, taking the popular 60-40 stock-bond portfolio as our use case. One alternative is an allocation to a trend-following strategy. The positive convexity of this overlay tends to counter the impact on drawdowns of the mechanical rebalancing strategy. The second alternative we call strategic rebalancing, which uses smart rebalancing timing based on trend-following signals – without a direct allocation to a trend-following strategy. For example, if the trend-following model suggests that stock markets are in a negative trend, rebalancing is delayed.

Notable quotations from the academic research paper:

"A pure buy-and-hold portfolio has the drawback that the asset mix tends to drift over time and, as such, is untenable for investors who seek diversification. However, a stock-bond portfolio that regularly rebalances tends to underperform a buy-and-hold portfolio at times of continued outperformance of one of the assets. Using a simple two-period model, we explain the main intuition behind this effect: rebalancing means selling (relative) winners, and if winners continue to outperform, that detracts from performance.

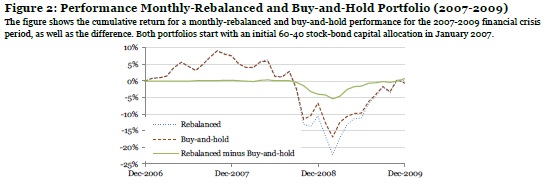
As stocks typically have more volatile returns than bonds, relative returns tend to be driven by stocks. Hence, of particular interest are episodes with continued negative (absolute and relative) stock performance, such as the 2007-2009 global financial crisis. In Figure 2, we contrast the monthly-rebalanced and buy-and-hold cumulative performance over the financial crisis period, where both start with an initial 60-40 stock-bond capital allocation. The maximum drawdown of the monthly-rebalanced portfolio is 1.2 times (or 5 percentage points) worse than that of the buy-and-hold portfolio, right at the time when financial markets turmoil is greatest.

Rebalanced and not rebalanced portfolio

In earlier work, Granger et al. (2014) formally show that rebalancing is similar to starting with a buy-and-hold portfolio and adding a short straddle (selling both a call and a put option) on the relative value of the portfolio assets. The option-like payoff to rebalancing induces negative convexity by magnifying drawdowns when there are pronounced divergences in asset returns. We show that time-series momentum (or trend) strategies, applied to futures on the same stock and bond markets, are natural complements to a rebalanced portfolio. This is because the trend payoff tends to mimic that of a long straddle option position, or exhibits positive convexity.

Trend exposure and portfolio drawdown

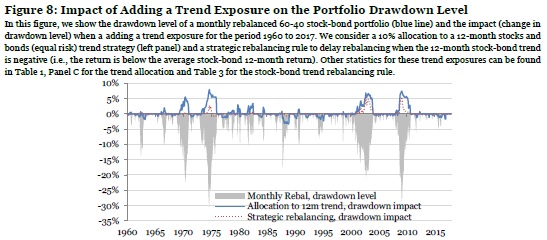
We evaluate how 1-, 3-, and 12-month trend strategies perform during the five worst drawdowns for the 60-40 stock-bond portfolio. Allocating 10% to a trend strategy and 90% to a 60-40 monthly-rebalanced portfolio improves the average drawdown by about 5 percentage points, compared to a 100% allocation to a 60-40 monthly rebalanced portfolio. The trend allocation has no adverse impact on the average return over our sample period. That is, while one would normally expect a drag on the overall (long-term) performance when allocating to a defensive strategy, in our sample, the trend-following premium earned offsets the cost (or insurance premium) paid.

An alternative to a trend allocation is strategically timing and sizing rebalancing trades, which we label strategic rebalancing. We first consider a range of popular heuristic rules, varying the rebalancing frequency, using thresholds, and trading only partially back to the 60-40 asset mix. Such heuristic rules reduce the average maximum drawdown level for the five crises considered by up to 1 percentage point. However, using strategic rebalancing rules based on either the past stock or past stock-bond relative returns gives improvements of 2 to 3 percentage points."


Are you looking for more strategies to read about? Check http://\/\/new-fmhwbzh6ghd9hede.swedencentral-01.azurewebsites.net/Screener

Do you want to see performance of trading systems we described? Check http://\/\/new-fmhwbzh6ghd9hede.swedencentral-01.azurewebsites.net/Chart/Performance

Do you want to know more about us? Check http://\/\/new-fmhwbzh6ghd9hede.swedencentral-01.azurewebsites.net/Home/About


Follow us on:

Facebook: https://www.facebook.com/quantpedia/

Twitter: https://twitter.com/quantpedia


Continue reading »
QuantPedia
Privacy Overview

This website uses cookies so that we can provide you with the best user experience possible. Cookie information is stored in your browser and performs functions such as recognising you when you return to our website and helping our team to understand which sections of the website you find most interesting and useful.