Introduction
Bitcoin is one of the most widely discussed financial assets of the modern era. Since its inception, it has evolved from a niche digital experiment into a globally recognized investment instrument with institutional adoption and billions in daily trading volume. Despite its inherent volatility, Bitcoin has demonstrated a strong long-term growth trajectory, making it an attractive candidate for trend-based and momentum-oriented trading strategies. As a decentralized, highly liquid, and 24/7 traded asset, it offers unique opportunities for systematic traders to explore algorithmic and technical approaches across multiple timeframes.
Technical analysis remains one of the most popular methods for understanding and capitalizing on Bitcoin’s price behavior. Traders commonly rely on tools such as Moving Averages, MACD, Pivot Points, and Price Action principles to identify trends, reversals, and momentum shifts. These indicators help translate Bitcoin’s complex market dynamics into structured, quantifiable signals suitable for rule-based strategies. In this study, we apply such technical concepts to construct and refine a trend-following strategy for Bitcoin, progressing step by step from a simple MACD setup toward an improved multi-timeframe model.
Goal
The primary goal of this study is to demonstrate a logical, step-by-step process of building a systematic trading strategy for Bitcoin. Instead of presenting a single optimized model, we focus on the gradual development of a transparent, rule-based framework, starting from a simple indicator setup and progressively refining it through rational improvements. Each enhancement is guided by clear logic rather than data mining or overfitting, ensuring that the strategy remains both interpretable and replicable.
We concentrate on a long-only approach, as cryptocurrencies like Bitcoin exhibit a long-term upward bias driven by adoption, scarcity, and macroeconomic factors. Long-only strategies are also more practical for retail and institutional investors, given the complexity and costs associated with shorting crypto assets. Our objective is therefore to design a realistic, growth-oriented Bitcoin model that captures medium-term trends while managing downside risk, illustrating how systematic improvements can enhance both stability and performance over time.
Data
The dataset is sourced from Gemini Exchange, which provides accurate and reliable historical Bitcoin/USD price records. Two granularities are used: hourly (1H) data for intraday signal testing and daily (1D) data for higher-timeframe trend identification (e.g., D1H1 filter).
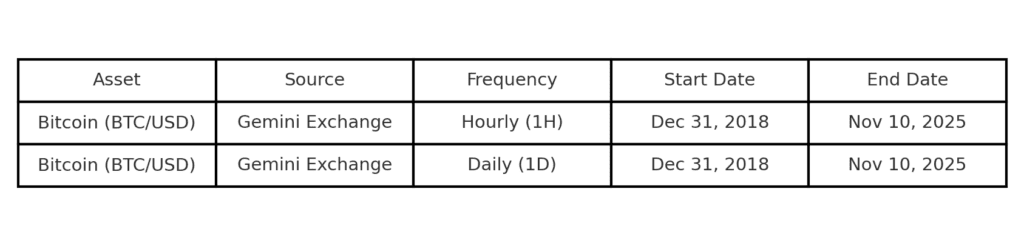
The analysis begins in December 2018, corresponding to the launch of CME Bitcoin Futures, the moment Bitcoin became widely accessible to institutional traders on regulated markets. Data prior to 2018 are excluded, as they represent a structurally different and less mature market environment that would be difficult to replicate today.
Bitcoin Buy & Hold Benchmark
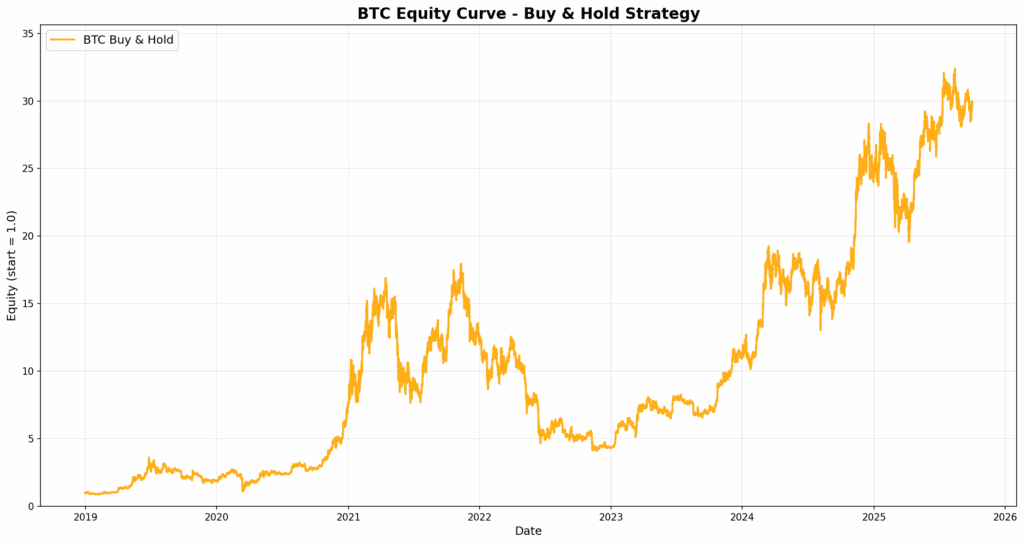
The following chart shows the Bitcoin Buy & Hold equity curve from December 2018 to November 2025. Over this period, Bitcoin achieved an impressive average annual return of over 60%, confirming its nature as a high-growth asset. However, this performance came at the cost of extreme volatility, with a maximum drawdown of nearly –80%, highlighting the enormous risk inherent in passive exposure to BTC.
While the long-term growth potential is undeniable, the depth and duration of historical drawdowns emphasize the need for systematic strategies and risk management frameworks to stabilize returns and protect capital.
📈 Figure: Bitcoin Equity Curve – Buy & Hold Strategy
Methodology
Our goal is to design a trend-following strategy for Bitcoin using hourly (1H) price data. Trend-following models are well suited for volatile assets like BTC, as they aim to capture medium-term directional moves while filtering out noise.
As a foundation, we employ the standard MACD indicator, one of the most established and widely used tools in technical analysis. The MACD (Moving Average Convergence Divergence) is calculated as the difference between two exponential moving averages (typically 12 and 26 periods) and generates trading signals based on its crossover with a 9-period signal line.
In this base version, we construct a simple long-only MACD crossover strategy:
Buy (Long) when the MACD line crosses above the signal line.
Close position (Flat) when the MACD line crosses below the signal line.
Timeframe: Hourly (1H).
This initial model serves as the starting point, a baseline to evaluate raw indicator behavior before introducing higher-timeframe filters or exit improvements in subsequent steps.
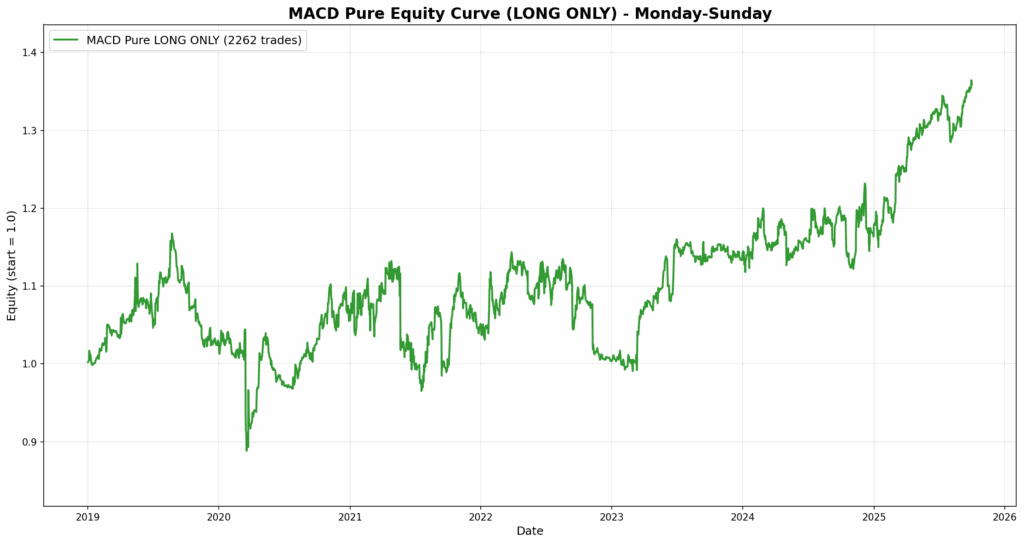
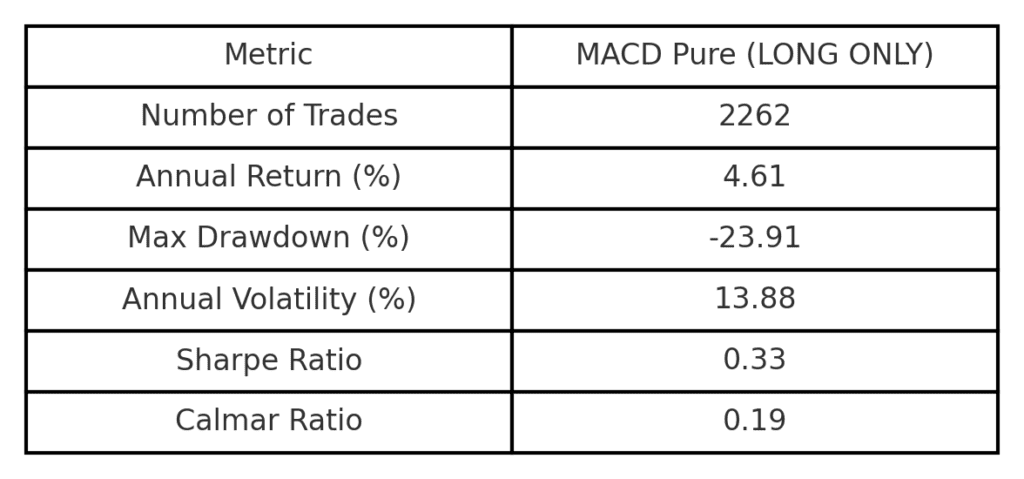
The first version of our model is a pure MACD crossover strategy on the hourly (1H) timeframe. The rules are straightforward: go long when the MACD line crosses above the signal line and close the position when it crosses below. This version uses no filters or exit logic; it simply tests whether the MACD indicator alone can identify profitable short-term trends on Bitcoin.
The strategy executes a very high number of trades (2,262), reflecting the noisy nature of hourly price action. Despite its activity, the results are not impressive. An annual return of only 4.6%, a Sharpe ratio of 0.33, and a Calmar ratio of 0.19 indicate poor efficiency and limited trend capture. The maximum drawdown of –23.9% confirms that, while risk is moderate compared to Buy & Hold, there is no significant edge.
In summary, this baseline test shows that the raw MACD signal on the 1H chart lacks selectivity and requires further refinement, such as trend confirmation from higher timeframes or improved exit management, to achieve meaningful performance improvements.
What Can Be Improved?
The pure MACD approach clearly lacks structure as it reacts to every small fluctuation on the hourly chart, generating many trades without delivering consistent results. Therefore, the next logical step is to reduce noise and improve signal quality rather than forcing optimization on parameters.
Inspiration from Classic Technical Analysis
We can achieve this by introducing multi-timeframe confirmation. In particular, we apply the classic “Elder principle,” which states that one should trade only in the direction of the dominant trend from a higher timeframe. The concept behind this improvement comes from one of the classics of technical trading, Alexander Elder’s book “Come Into My Trading Room.” Elder introduced the idea of the Triple Screen System, which became a cornerstone of professional technical analysis.
The principle is simple yet powerful:
“Look at a higher timeframe to identify the main trend, and then switch to a lower timeframe to find precise entries in its direction.”
In our context, this means checking the Daily (D1) chart first to determine whether Bitcoin is in an uptrend or downtrend. Once the dominant trend is confirmed, we move to the Hourly (H1) chart and take trades only in the direction of that daily trend.
By adding a Daily (D1) trend filter to our Hourly (H1) MACD entries, we align short-term signals with the broader market direction.
This adjustment should significantly reduce false signals, decrease trade frequency, and improve both Sharpe and Calmar ratios. In the following step, we implement this D1H1 filter and examine how it refines the entry logic and overall performance of the strategy. Quick note here – the daily signal (and therefore whole D1H1 filter) is applied only once the actual daily candle is finished, so after midnight.
D1H1 Filter (Improved Entries)
To make the strategy more selective in its entries, we introduce a D1H1 multi-timeframe filter inspired by Alexander Elder’s principle: “Always trade in the direction of the higher timeframe trend.” While the base MACD model reacts to every small intraday fluctuation, this filter ensures that trades are only taken when the broader market context supports them.
The logic is as follows:
On the Daily (D1) timeframe, determine the primary trend using the MACD indicator.
If the D1 MACD line is above its signal line, the market is in an uptrend.
If the D1 MACD line is below its signal line, the market is in a downtrend.
On the Hourly (H1) timeframe, take trades only in the direction of the D1 trend.
If D1 shows an uptrend, execute long entries only when the H1 MACD crosses upward.
Ignore short signals entirely.
This simple addition removes counter-trend trades and focuses the strategy on high-probability setups aligned with the prevailing daily direction. As a result, the number of trades decreases, but the risk-adjusted performance improves, typically reflected in a higher Sharpe and Calmar ratio and a smoother equity curve.
This classical top-down logic allows the strategy to avoid counter-trend noise, focus on the strongest market phases, and trade only when both timeframes are synchronized.
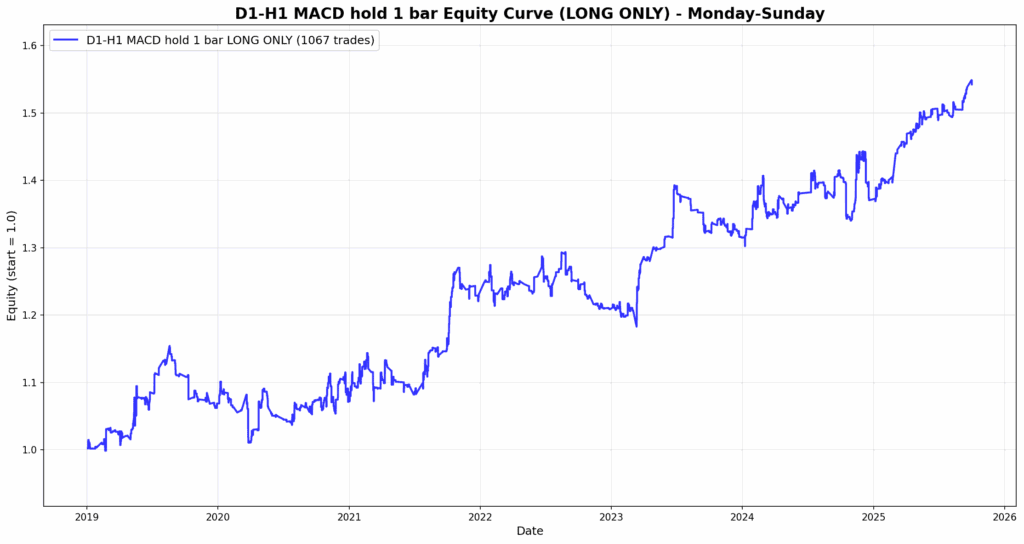
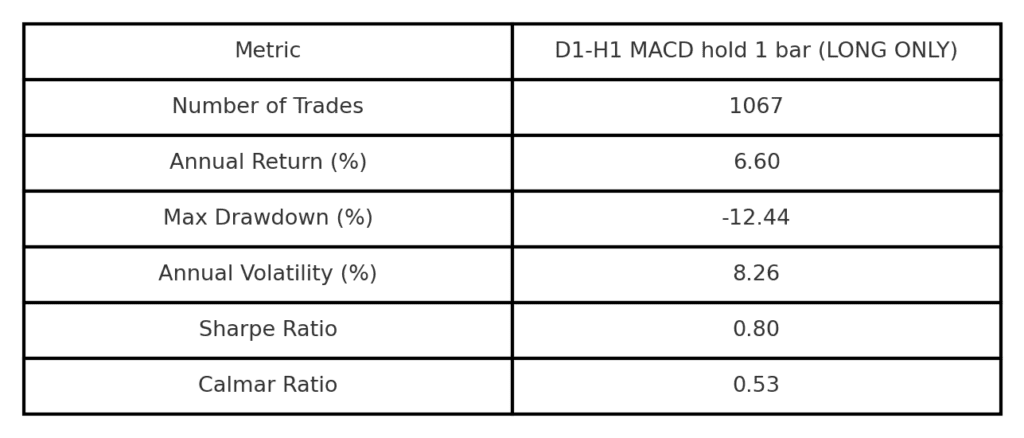
Results – Improved Selectivity and Entry Quality
In this version, the holding period remains one bar, meaning the strategy still opens and closes positions within a single hourly candle. What changes, however, is the quality of entries. Thanks to the D1H1 filter, the strategy now trades only in the direction of the dominant daily trend, which significantly reduces noise and eliminates most counter-trend setups.
As a result, we see a clear improvement in stability and consistency. The number of trades drops from over 2,200 to around 1,000, but the risk-adjusted metrics improve noticeably. Annual return rises to 6.6% (from 4.6%), maximum drawdown improves from –23.9% to –12.4%, and the Sharpe ratio increases from 0.33 to 0.80.
Although the overall profit remains modest, this step demonstrates the power of higher timeframe confirmation. It is a simple, logical enhancement that filters out poor market conditions and focuses the model on stronger, trend-aligned entries.
What Can Be Improved Further
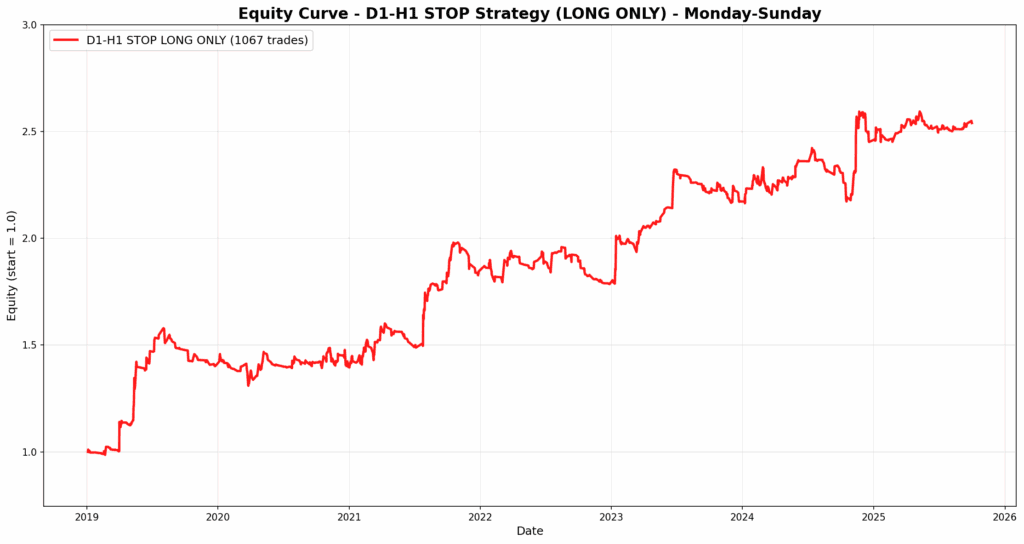
After improving the entry logic with the D1H1 filter, the next natural step is to enhance the exit mechanism. The current version closes trades after holding for a fixed one bar, which is simple but often inefficient. Strong trends may continue for several hours, yet the model exits too early and leaves a significant portion of potential profit on the table.
To address this, we introduce a basic trailing stop logic, one of the most intuitive ways to improve exits without overcomplicating the system. In our case, the rule is straightforward. After entering a long position, we continue holding as long as hourly bars remain positive, meaning each candle closes higher than it opens. The position is closed at the close of the first negative bar, signaling the first potential sign of short-term weakness.
This simple trailing exit allows the strategy to capture more of the ongoing trend while automatically cutting off flat or reversal periods. It is not based on optimization or indicators, only on price behavior itself, which makes it both transparent and robust.
In the next step, we apply this trailing logic to the D1H1 model and evaluate how it affects profitability, volatility, and drawdowns.
Conclusion & Discussion
Throughout the study, our goal was to develop a Bitcoin trend-following model step by step, not through optimization but through logical structural improvements. Each enhancement was grounded in a clear rationale and demonstrated measurable progress in stability and efficiency.
- MACD Pure (Base Strategy) served as a benchmark test of the indicator itself. The results showed high trade frequency and weak profitability, proving that raw signals from a single timeframe are insufficient.
- D1H1 Filter (Improved Entries) introduced the classical top-down confirmation approach. By trading only in the direction of the higher daily trend, we reduced noise, improved selectivity, and achieved smoother equity growth.
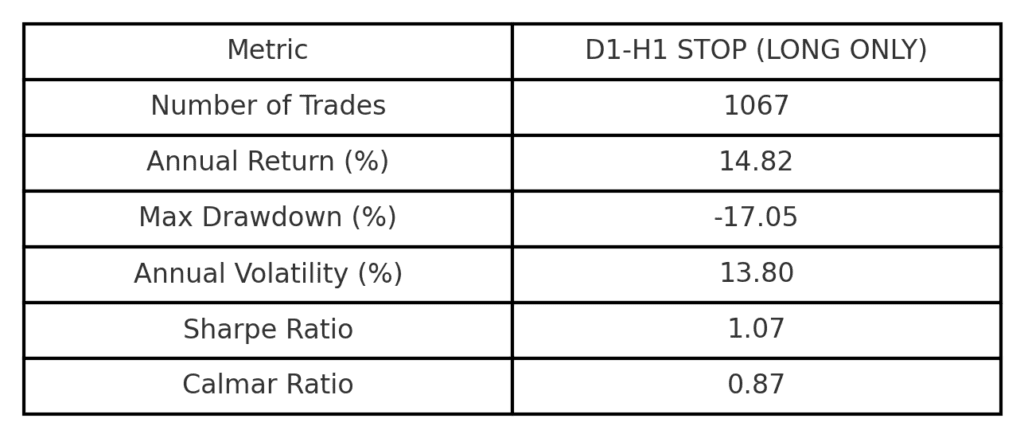
- D1H1 + Trailing Stop (Improved Exits) further refined the strategy by allowing positions to remain open as long as hourly candles stayed positive. This simple trailing exit captured stronger trends and improved both Sharpe (1.07) and Calmar (0.87) ratios.
Overall, the evolution from a simple MACD model to a multi-timeframe, price-behavior-aware strategy demonstrates a key principle of systematic trading: robustness comes from structure, not complexity. Even without parameter optimization, each logical layer—higher timeframe filtering and adaptive exits—contributed to a more realistic, stable, and risk-efficient long-only framework for Bitcoin.
The final version, D1H1 STOP, illustrates that discipline and logical design can transform a mediocre trading rule into a consistent and replicable quantitative strategy suitable for modern crypto markets.
Author: David Mesíček, Junior Quant Analyst, Quantpedia
Are you looking for more strategies to read about? Sign up for our newsletter or visit our Blog or Screener.
Do you want to learn more about Quantpedia Premium service? Check how Quantpedia works, our mission and Premium pricing offer.
Do you want to learn more about Quantpedia Pro service? Check its description, watch videos, review reporting capabilities and visit our pricing offer.
Are you looking for historical data or backtesting platforms? Check our list of Algo Trading Discounts.
Would you like free access to our services? Then, open an account with Lightspeed and enjoy one year of Quantpedia Premium at no cost.
Or follow us on:
Facebook Group, Facebook Page, Twitter, Linkedin, Medium or Youtube


