The low-risk anomaly in financial markets has puzzled researchers and investors, challenging the traditional risk-return paradigm (higher risk->higher return). This phenomenon, where low-risk assets outperform their high-risk counterparts on a risk-adjusted basis, has been observed across various asset classes, including stocks and mutual funds. What may be the possible explanation? Pass-through mutual funds, which aim to replicate the performance of specific market indices, play a crucial role in this context by channeling investor flows and potentially influencing asset prices through demand pressure.
The interplay between mutual fund flows, demand pressure, and the low-risk anomaly has gained significant attention in recent years, particularly in light of the Inelastic Market Hypothesis. This hypothesis suggests that the price impact of trading activity can be substantial due to limited market elasticity. As investors allocate capital to pass-through mutual funds (closet index funds), the resulting flow of funds can create demand pressure on underlying assets, potentially affecting their prices and returns. This mechanism may contribute to the persistence of the low-risk anomaly and has important implications for market efficiency, asset pricing models, and investment strategies.
Authors provide compelling evidence that mutual fund flows significantly explain the beta anomaly in asset pricing. Their analysis reveals that the beta anomaly manifests only following uptrend markets, while the CAPM holds following downtrend markets. Mutual funds with high-beta assets receive significantly larger capital flows than those with low-beta assets with market fluctuations during uptrend markets. This leads to more significant cumulative demand pressure on high-beta assets.
Due to their substantially less elastic demand than low-beta assets, high-beta assets experience more pronounced price impacts and subsequent underperformance (reversal) exclusively following uptrend markets. What’s the takeaway? Authors’ study highlights the importance of distinguishing between uptrend and downtrend market conditions in asset pricing research. The trend-based measure they introduce captures long-term accumulating flow-driven demand pressures, more directly examining how market dynamics contribute to the beta anomaly than sentiment-based measures.
Authors: Seokwoo Lee and Matthew Linn
Title: Pass-through Mutual Funds, Flow of Funds, and Low-Risk Anomaly
Link: https://papers.ssrn.com/sol3/papers.cfm?abstract_id=4993876
Abstract:
We explain the low-risk anomaly in stock returns, attributing it to demand pressure from mutual funds that pass through the flows from their investors. Our analysis shows that when investors chase returns, mutual funds with high-beta assets receive significantly larger flows following market fluctuations than those with low-beta assets, leading to greater demand pressure on high-beta assets. Due to the substantially inelastic demand for high-beta assets relative to low-beta assets, this pressure leads to more pronounced price impacts on high-beta stocks. Notably, we show that the beta anomaly is present only following uptrend markets, with the CAPM holding otherwise. Investors persistently allocate capital to high-beta funds during uptrends but adopt a more conservative approach in downtrends. This accumulated demand pressure leads to overpricing of high-beta stocks and lower expected returns. By controlling for market trends and related demand pressure, we effectively eliminate the negative risk-adjusted returns of high-beta stock portfolios.
As always, we present several interesting figures and tables:
Notable quotations from the academic research paper:
“One of the key findings of our analysis is that market trend conditions primarily drive the low-risk anomaly. We demonstrate that the beta anomaly manifests only following uptrend markets, while the CAPM holds following downtrend markets. Standard Fama-MacBeth regression results reveal that after uptrend markets, the CAPM-predicted price of risk (¯rem) substantially exceeds the estimated price of risk (ˆλ), with both economic and statistical significance (difference of 0.94% per month with t-statistic 3.44 in Table 9). Conversely, this difference becomes economically and statistically insignificant following downtrend markets (0.06% per month with t-statistic 0.2). We define uptrend and downtrend markets based on whether the cumulative past 24-month market returns are above or below the median, respectively.3
We find strong evidence for inelatic asset demand curves, leading to the economically significant price impacts of flow-induced demand pressure. In theory, if arbitrageurs could bear unlimited risk, they would take infinitely large positions to fully absorb any demand pressure, resulting in flat demand curves and no price impact. However, our results, consistent with Gabaix and Koijen (2022), demonstrate that capital markets are sufficiently inelastic to generate substantial effects on asset returns from demand pressure.4
[Authors] find that the funds with high-beta assets consistently receive significantly larger capital flows than those with low-beta assets following market fluctuations. The results are both statistically significant and economically sizeable. To illustrate, in January 2022, the average assets under management (AUM) of the top 20% high-beta funds is $3.9 billion. The monthly market volatility is about 4.4%. Given a one standard deviation increase in the market return, on average, a median AUM fund with high beta assets receives 12 million dollars more than those with low beta assets, holding the fund’s other characteristics constant. With about 600 funds falling into the high-beta category, this translates to an influx of approximately $7.2 billion in new capital compared to the funds with low-beta assets.
Secondly, we demonstrate that high-beta assets experience larger demand pressure from funds for a given change in market returns compared to low-beta assets. This aligns with our observation that funds tilting toward high-beta assets experience larger flows in response to market fluctuations relative to low-beta funds. To quantify the demand pressure from mutual fund flows on individual stocks, we employ the Flow-Induced Trading (FIT) measure introduced by Lou (2012).
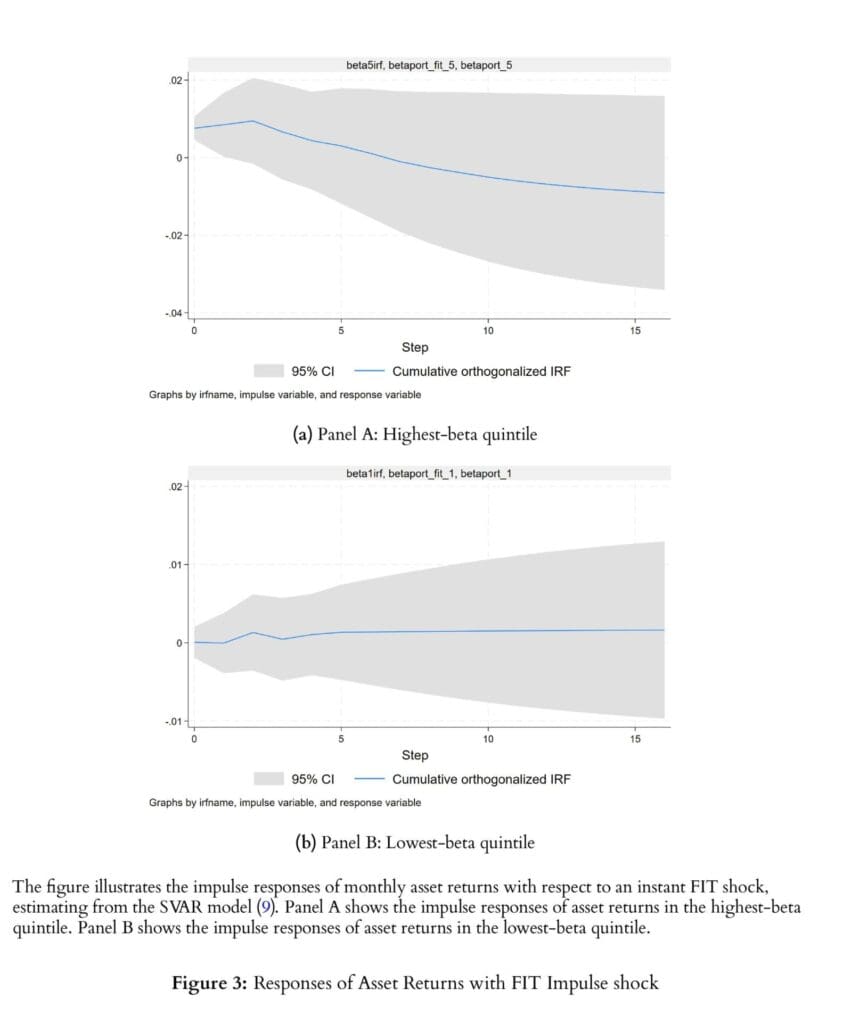
To further quantify the mechanism underlying the differential impact of flow-induced trading on high-beta and low-beta stocks, we employ a structural vector autoregressive (SVAR) model (Blanchard and Quah, 1989). This model captures the joint dynamics of market returns, fund flows (and consequently, FIT), and stock returns. Figure 3 illustrates the dynamic responses of portfolio returns to a unit impulse in FIT.5 A flow shock, represented by a shock to FIT, has an economically sizeable impact on high-beta portfolio returns (Panel A). This positive price impact is statistically robust and appears to dissipate gradually over time, indicating a slow reversal. In contrast, the impact of flow-induced trading on low-beta portfolio returns is both economically and statistically insignificant (Panel B).
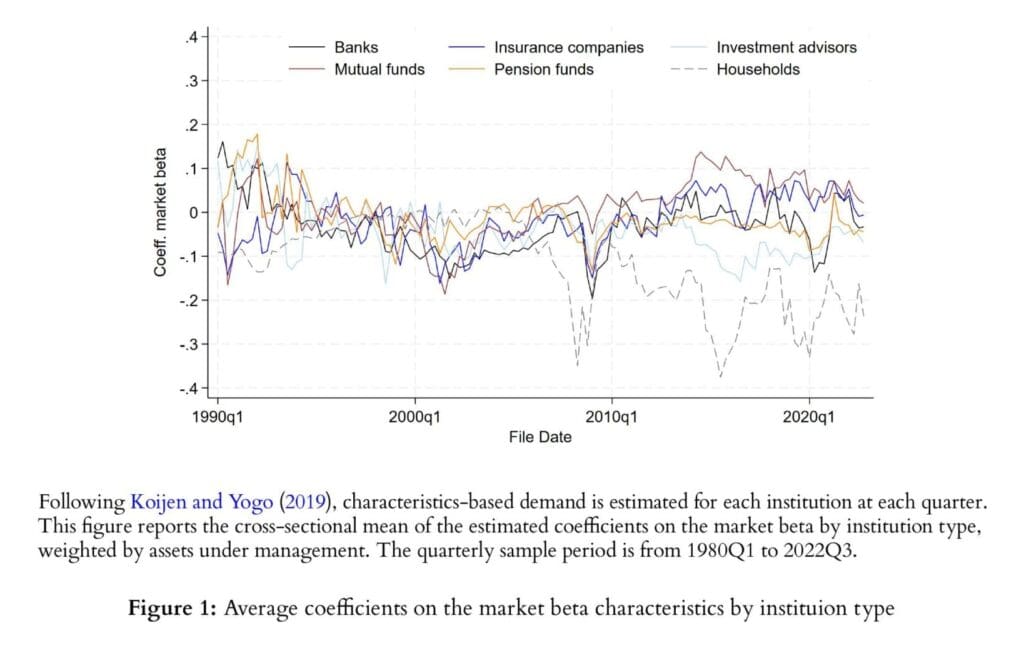
Figure 1 represents the results of time-varying tilting toward the market beta. […] Figure 1 illustrates that the cross-sectional mean coefficients of market beta are consistently positive, both statistically and economically significant over time. This finding implies that the average mutual fund manager’s strategy optimally tilts toward high-beta assets.”
Are you looking for more strategies to read about? Sign up for our newsletter or visit our Blog or Screener.
Do you want to learn more about Quantpedia Premium service? Check how Quantpedia works, our mission and Premium pricing offer.
Do you want to learn more about Quantpedia Pro service? Check its description, watch videos, review reporting capabilities and visit our pricing offer.
Are you looking for historical data or backtesting platforms? Check our list of Algo Trading Discounts.
Or follow us on:
Facebook Group, Facebook Page, Twitter, Linkedin, Medium or Youtube


