Returns to Investors in Initial Coin Offerings

A very interesting research paper we recommend to read to all cryptocurrency traders and investors:

Authors: Benedetti, Kostovetsky

Title: Digital Tulips? Returns to Investors in Initial Coin Offerings

Link: https://papers.ssrn.com/sol3/papers.cfm?abstract_id=3182169

Abstract:

Initial coin offerings (ICOs), sales of cryptocurrency tokens to the general public, have recently been used as a source of crowdfunding for startups in the technology and blockchain industries. We create a dataset on 4,003 executed and planned ICOs, which raised a total of $12 billion in capital, nearly all since January 2017. We find evidence of significant ICO underpricing, with average returns of 179% from the ICO price to the first day’s opening market price, over a holding period that averages just 16 days. Even after imputing returns of -100% to ICOs that don’t list their tokens within 60 days and adjusting for the returns of the asset class, the representative ICO investor earns 82%. After trading begins, tokens continue to appreciate in price, generating average buy-and-hold abnormal returns of 48% in the first 30 trading days. We also study the determinants of ICO underpricing and relate cryptocurrency prices to Twitter followers and activity. While our results could be an indication of bubbles, they are also consistent with high compensation for risk for investing in unproven pre-revenue platforms through unregulated offerings.

Notable quotations from the academic research paper:

"The traditional sources for seed and early-stage funding have recently been supplemented with crowdfunding: raising money from many small investors, in small amounts, over the Internet. Early on, crowdfunding was provided in exchange for future rewards or deals on products (e.g., Indiegogo, Kickstarter), and more recently for securities (equity crowdfunding). Advances in the blockchain technology have also led to a new hybrid form of crowdfunding: token offerings, also known as initial coin offerings (ICOs), which are the subject of this paper.

Tokens are cryptocurrencies, digital currencies for which all records and transaction data are protected by cryptographic methods. Entrepreneurs issue branded tokens to raise capital to create an online platform or ecosystem, in which all transactions require the use of that native token. In the 16 months since January 2017, over 1,000 startups successfully raised a total of about $12 billion using ICOs.

The closest analogue to the ICO is the Initial Public Offering (IPO) of equity. In addition to selling a different asset, two key differences between ICOs and IPOs are: (1) ICO firms are much younger and smaller, typically in the earliest stage of a firm’s life cycle, and (2) ICO firms do not use an underwriter to help determine value and attract buyers. As a result, it is not clear how two well-known characteristics of the IPO market, underpricing and post-IPO underperformance translate to ICOs and listed tokens.

In this paper, we study the market for crypto-tokens, focusing on how entrepreneurs determine the price for tokens, the returns to investors from buying tokens during an ICO and selling them once they are listed on an exchange, and the returns to investors from investing in tokens on the listing date and holding them for various fixed time horizons. We also use data from Twitter accounts of cryptocurrency firms to investigate the relationship between Twitter followers and activity, and market prices, and to measure the attrition rate of crypto-companies after completion of the ICO. Our paper aims to provide a comprehensive analysis of how startups in this industry transition and perform from birth, through the offering, to the listing, and beyond.

Figure 3 illustrates that most tokens were sold below their market price, but also, that many tokens were overpriced, and declined in value. The red-dashed line, which is the best fit line, is above the x-axis for the entire sample period, indicating that the average (log) return is positive, but it has a negative slope, suggesting that underpricing of tokens has declined over time (i.e., returns to ICO investors have been declining).

ICO performance chart

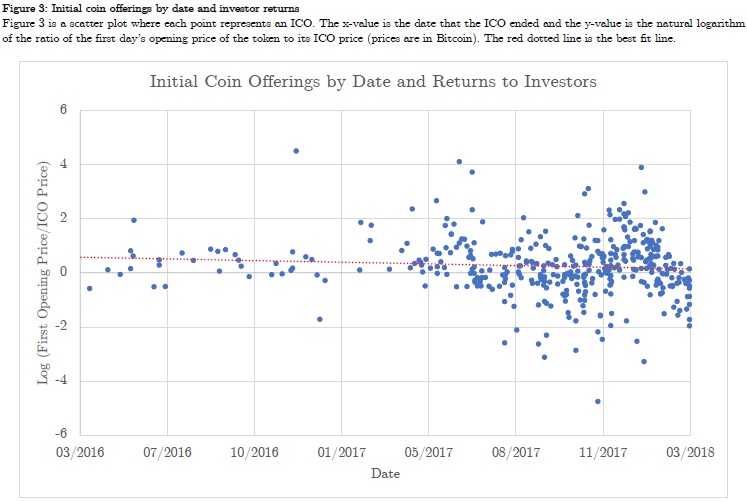
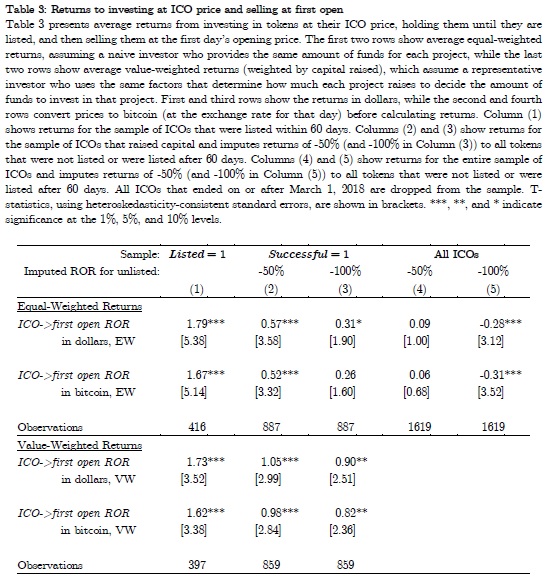
Table 3 shows the average returns to investing in an ICO. We start by calculating returns to investors in 416 ICOs that went on to list, in less than 60 days, and report the results in Column (1) of Table 3. The average of equal weighted returns to investing in listed ICOs is a statistically significant 179% and 167% (in Bitcoin), with a very similar 173% and 162% (in Bitcoin) value-weighted average. From the sellers’ point of view, crypto-companies are, on average, issuing tokens for less than half of their true market value, leaving significant money on the table.

For Columns (2) and (3), we also include (in addition to the 416 listed ICOs) another 471 ICOs that reported raising capital but did not list within 60 days. Since there are no available market values for these tokens in the aftermath of the ICO, we impute returns under two different scenarios. In Column (2), the average imputed return to unlisted tokens is -50%. Unlisted tokens investments are not a total loss if the raised capital is refunded due to inadequate funds, if there is an over-the-counter market for them, or if the tokens are listed on an exchange which is not included in CMC. With imputed returns of -50% to unlisted ICOs, average ICO returns are unsurprisingly lower than in Column (1), 57% and 52% (in Bitcoin) for equal-weighted averages and 105% and 98% (in Bitcoin) for value-weighted averages, but still positive and statistically significant. In Column (3), we look at worst-case scenario, imputing -100% to all ICOs that raised capital but did not list within 60 days. Under this scenario, the equal-weighted average returns are 31% and 26% (in Bitcoin) and are no longer significant at the 5% level, but the value-weighted returns remain larger in magnitude and significant at 90% and 82% (in Bitcoin).

For Columns (4) and (5), we include an additional 732 ICOs that neither reported raising capital nor were listed within 60 days. Again, we calculate and report average equal-weighted investor returns after imputing -50% (in Column (4)) and -100% (in Column (5)) returns to unlisted ICOs. Since these ICOs raised little or no capital, they do not change the value-weighted returns we calculated and displayed in the last two rows of Columns (2) and (3). When including these ICOs, equal-weighted returns are reduced to 9% (6% in Bitcoin) with a -50% imputed return, and -28% (-31% in Bitcoin) with an imputed return of -100%. These are the returns to a naïve investor who invests across all ICOs, even those that didn’t report raising capital, and they provide a lower bound to naïve investor returns. However, they are not at all a realistic estimate of returns, even for naïve investors, because many of the ICOs that don’t report raising capital (and many of those that report raising capital but do not list) either refunded the capital they raised because of inadequate funds or they planned an ICO but never actually began collecting funds.

ICO Performance table

"


Are you looking for more strategies to read about? Check http://\/\/new-fmhwbzh6ghd9hede.swedencentral-01.azurewebsites.net/Screener

Do you want to see performance of trading systems we described? Check http://\/\/new-fmhwbzh6ghd9hede.swedencentral-01.azurewebsites.net/Chart/Performance

Do you want to know more about us? Check http://\/\/new-fmhwbzh6ghd9hede.swedencentral-01.azurewebsites.net/Home/About


Follow us on:

Facebook: https://www.facebook.com/quantpedia/

Twitter: https://twitter.com/quantpedia

Continue reading »

Are Currently Used Significance Levels for Investment Strategies Too Strict?

Authors: de Prado, Lewis

Title: What is the Optimal Significance Level for Investment Strategies?

Link: https://papers.ssrn.com/sol3/papers.cfm?abstract_id=3193697

Abstract:

Most papers in the financial literature estimate the p-value associated with an investment strategy, without reporting the power of the test used to make that discovery. This is a mistake, because a particularly low false positive rate (Type I error) may be achieved at the expense of missing a large proportion of the investment opportunities (Type II error). In this paper we provide analytic estimates to Type I and Type II errors in the context of investments, and derive the familywise significance level that optimizes the performance of hypothesis tests under general assumptions. Contrary to long-held beliefs, we conclude that a familywise significance level below 15% is suboptimal (excessively conservative) in the context of most investment strategies.

Notable quotations from the academic research paper:

"Financial researchers conduct thousands (if not millions) of backtests before identifying an investment strategy. Hedge funds interview hundreds of portfolio managers before filling a position. Asset allocators interview thousands of asset managers before building a template portfolio with those candidates that exceed some statistical criteria. What all these examples have in common is that statistical tests are applied multiple times. When the rejection threshold is not adjusted for the number of trials (the number of times the test has been administered), false positives (Type I errors) occur with a probability higher than expected.

Empirical studies in economics and finance often fail to report the power of the test used to make a particular discovery. Without that information, readers cannot assess the rate at which false negatives occur (Type II errors). Suppose that you are a senior researcher at the Federal Reserve Board of Governors, and you are tasked with testing the hypothesis that stock prices are in a bubble. At first, you apply a high significance level, because before making a claim that might trigger draconian monetary policy actions you want to be extremely confident. At a 99% confidence level, you cannot reject the null hypothesis that stock prices are not in a bubble. When you report your findings to the Board, the chairperson asks what is the power of the test. Surprised by the unexpected request, you promise that you will report the test’s true positive probability in the next meeting. Back at your office, you are shocked to realize that, unbeknownst to you, the test’s power is only 50%. In other words, the test is so conservative that it misses half of the bubbles. At the next meeting, the chairperson shakes his head while explaining that, from the Fed’s perspective, missing half of the bubbles is much worse than taking a 1% risk of triggering a false alarm.

In contrast, hedge funds are often more concerned with false positives than with false negatives. Client redemptions are more likely to be caused by the former than the latter. Also, investors know that performance fees incentivize managers to avoid false negatives, hence a “safety first” principle calls for investors to focus on avoiding false investment strategies. Although this is a valid argument, it is unclear why investors and hedge funds would apply arbitrary significance levels, such as 10% or 5% or 1%. Rather, an objective significance level could be set such that Type I and Type II errors are jointly minimized. In other words, even researchers who do not particularly care for Type II errors could compute them as a way to introduce objectivity to an otherwise subjective choice of significance level.

The purpose of this paper is threefold: First, we provide an analytic estimate to the probability of selecting a false investment strategy, corrected for multiple testing. Second, we provide an analytic estimate to the probability of missing a true investment strategy, corrected for multiple testing. Third, we derive the significance level that maximizes the performance of a statistical test used to detect investment strategies.

WHAT IS A REASONABLE SIGNIFICANCE LEVEL FOR INVESTMENT STRATEGIES?

For the particular numerical example presented earlier, where ≈2.4978 and the true Sharpe ratio was assumed to be ∗≈0.0632 (annualized Sharpe ratio of 1.0), the harmonic mean between confidence and power is maximized at ∗ ≈0.3051 and ≈0.4224, where ℎ≈0.6309. Exhibit 2 plots ℎ (y-axis) as a function of (x-axis).

harmonic mean

The reader may be surprised to learn that the optimal significance level is so high, compared to the standard 5% false positive rate used throughout the academic literature. The reason is, at the standard significance level of =0.05, the test is so powerless that it misses over 71.55% of strategies with a true Sharpe ratio below 1! It is therefore optimal to give up some confidence in exchange for more power, even if that means accepting a false positive rate as high as 30.51%.

Optimal FWER

Similarly, we can compute the optimal FWER ∗ under alternative assumptions of ∗. Exhibit 3 plots the optimal ∗ (y-axis) under various ∗ values (x-axis) and sample lengths (different lines) for the same numerical example, where Ì‚=0.0791, =10, skewness is -3 and kurtosis is 10. The implication is that, unless you are researching a strategy with a true annualized Sharpe ratio above 1 over a period of more than 10 years of daily data, a FWER below 15% is likely to be excessively conservative.

"


Are you looking for more strategies to read about? Check http://\/\/new-fmhwbzh6ghd9hede.swedencentral-01.azurewebsites.net/Screener

Do you want to see performance of trading systems we described? Check http://\/\/new-fmhwbzh6ghd9hede.swedencentral-01.azurewebsites.net/Chart/Performance

Do you want to know more about us? Check http://\/\/new-fmhwbzh6ghd9hede.swedencentral-01.azurewebsites.net/Home/About


Follow us on:

Facebook: https://www.facebook.com/quantpedia/

Twitter: https://twitter.com/quantpedia

Continue reading »

Are Investors Becoming Better at Fund Picking?

No, investors seem to learn from past mistake of chasing past performace but are prone to new mistakes – especially to chasing past alpha:

Authors: Friesen, Nguyen

Title: The Economic Impact of Mutual Fund Investor Behaviors

Link: https://papers.ssrn.com/sol3/papers.cfm?abstract_id=3160271

Abstract:

This study analyzes how the determinants of mutual fund investor cash flows have changed over time, and the associated impact on investor returns. Using data from 1992-2016 we find that investor return-chasing behavior essentially disappeared starting in 2011. Investor flows have become more sensitive to expenses, past risk and alpha. Investors are paying more attention to fund characteristics that matter (e.g. risk, alpha and expenses), and less attention to characteristics that don’t (e.g. past returns). Nevertheless, the average investor dollar-weighted return is about 1.2% below the average buy-and-hold return in their underlying mutual fund nearly every year in our sample, suggesting consistently poor timing ability over the entire period. We decompose the economic impact of investor behaviors on investor returns and find that investors’ focus on alpha is actually more detrimental than their previous focus on past returns. Investors do benefit from choosing high-alpha funds (smart money), but poorly time their cash flows by investing in those funds after periods with the highest realized alphas (dumb money). The dumb money effect dominates the smart money effect for the simple reason that at the fund level, past alphas are strongly and negatively correlated with future alphas. Although past alphas are positively correlated to future alphas in the pooled cross-section of mutual fund data, this result does not hold at the individual fund level, which is the level where most mutual fund customers invest. Overall, our results suggest that mutual fund investors know that alpha is important, but have not yet learned how to effectively integrate this knowledge into their investment decisions.

Notable quotations from the academic research paper:

"In this study, we examine how the determinants of mutual fund investor cash flows have changed over the past twenty-five years, the economic impact of these changes on investor returns, and ask what these changes tell us about learning among these investors.

Our contributions are of three-fold: first, we document several changes in investor behaviors in the mutual fund industry over our sample period of 1992-2016:  investor return- chasing behavior has essentially disappeared starting in 2011; investor flows have become much more sensitive to expenses and past risk; and that the sensitivity of cash flows to fund alpha has been steady or increasing throughout the entire period. To our knowledge, this is the first study to directly measure and report these time-trends in investor behavior.

Second, we develop and present a decomposition which captures the economic impact of each incremental change in behavior. We then estimate the economic impact and for each behavior, specifically the return- chasing, the alpha-chasing, and risk sensitivity behaviors.  Among other things, we find that investors’ focus on alpha is actually more detrimental than their previous focus on past returns.

Third, we show that once we control for variation in average alpha levels across funds, future alphas are negatively correlated with past alphas at the fund level.  The results support the presence of both a “smart money effect” (which arises from investors chasing alphas, which are positively correlated in the pooled cross-section) and a “dumb money effect” (which arises from investors chasing alphas, which are negatively autocorrelated at the fund level).  The economic impact of the “dumb money” effect dominates that of the “smart money” effect.  Paying attention to alpha in the current manner is worse than not paying attention to alpha at all.

The claim that future alphas are negatively correlated with past alphas is at odds with the findings of several studies, including a study done by Elton, Gruber, and Blake (2011), which reports a positive correlation between past and future alphas.  We show that while past and future alphas are positively correlated in the pooled cross-section, this relationship breaks down at the fund level, where most retail investors actually invest.  At the fund level, past alphas are strongly and negatively correlated with future alphas, regardless of the time-horizon or factor-model used.  This is why chasing past alphas is detrimental to investor returns.

"


Are you looking for more strategies to read about? Check http://\/\/new-fmhwbzh6ghd9hede.swedencentral-01.azurewebsites.net/Screener

Do you want to see performance of trading systems we described? Check http://\/\/new-fmhwbzh6ghd9hede.swedencentral-01.azurewebsites.net/Chart/Performance

Do you want to know more about us? Check http://\/\/new-fmhwbzh6ghd9hede.swedencentral-01.azurewebsites.net/Home/About


Follow us on:

Facebook: https://www.facebook.com/quantpedia/

Twitter: https://twitter.com/quantpedia

Continue reading »

Quantpedia Update – 11th June 2018

Two new strategies have been added:

#391 – The Conservative Formula
#392 – Intraday Market-Wide Ups/Downs and Returns

Two new related research papers have been included into existing strategy reviews. And three additional related research papers have been included into existing free strategy reviews during last 2 weeks.

Continue reading »

EquitesLab Out-Of-Sample Test of F-Score and Equity Reversal Strategy

We would again like to present a very interesting cooperation, this time with a guys from EquitiesLab.

They too started to analyze some of Quantpedia's suggested strategies. The first article (https://www.equitieslab.com/f-score-and-short-term-reversals/) analyzes a combination of a well-known fundamental Piotrovski's F-Score strategy with a Short-Term Reversal (see Combining Fundamental FSCORE and Equity Short-Term Reversals for details). Combined strategy shows nice outperformance since year 2000. A long-short strategy trails a strong S&P 500 performance during last few years, but it can be expected in such strong bull market. However, probably the most interesting feature is strategy's outperformance during crisis years like 2001, 2002, 2008 and 2011:

Strategy's performance


Are you looking for more strategies to read about? Check http://\/\/new-fmhwbzh6ghd9hede.swedencentral-01.azurewebsites.net/Screener

Do you want to see performance of trading systems we described? Check http://\/\/new-fmhwbzh6ghd9hede.swedencentral-01.azurewebsites.net/Chart/Performance

Do you want to know more about us? Check http://\/\/new-fmhwbzh6ghd9hede.swedencentral-01.azurewebsites.net/Home/About


Follow us on:

Facebook: https://www.facebook.com/quantpedia/

Twitter: https://twitter.com/quantpedia

Continue reading »

Currency Management with FX Style Factors

A new financial research paper has been published and it is related to:

#5 – FX Carry Trade
#8 – FX Momentum
#9 – FX Value – PPP Strategy

Authors: Lohre, Kolrep

Title: Currency Management with Style

Link: https://papers.ssrn.com/sol3/papers.cfm?abstract_id=3175387

Abstract:

Currency hedging is often approached with an all-or-nothing mentality: either full hedging of all foreign exchange (FX) positions or no hedging at all. As a more nuanced alternative, we suggest systematically harvesting the benefits of the FX style factors carry, value and momentum. In particular, we demonstrate how these factors can expand the opportunity set of traditional asset allocation when pursuing either FX factor-based tail-hedging or return-seeking strategies.

Notable quotations from the academic research paper:

"There are good reasons to believe that the optimal currency hedge lies between the two extremes of a full hedge and no hedge at all. We believe that it pays off to have a closer look at currency style factors for determining a beneficial currency allocation.

FX style factors vis-à-vis multi-asset classes We will now demonstrate the mean-variance properties of FX style factors relative to traditional asset classes. Figure 1 depicts a mean-variance diagram of the three FX style factors carry, value and momentum, as well as five traditional asset classes as given by US equity, US Treasuries, US corporate bonds (investment grade and high yield).

FX style factors

First, we inspect the investment opportunity set of traditional multi-asset investors based solely on the latter five asset classes. In particular, we take the perspective of a EUR investor who is fully hedging USD/EUR exposure. The left chart in figure 2 shows the ensuing mean-variance allocations along the efficient frontier for the five multi-assets only. Going from left to right, we learn that a more defensive investor would have allocated towards government
bonds, whereas the latter allocation for less riskaverse investors gives way to investment grade and high yield credit positions.

FX style factors 2

Second, adding the three FX style factors to the mix would significantly expand investors’ opportunity set. The ensuing efficient frontier including FX styles shifts considerably to the northwest compared to the multi-asset-only allocation. Obviously, the inclusion of the FX carry and value factors is expanding the portfolio return perspective. Still, judging from the corresponding mean-variance allocations, we learn that all three FX style factors crucially enhance the tail-hedging capabilities of any multi-asset investor, as demonstrated by their large portfolio weights in the minimum-variance portfolio. While FX momentum does play a role, especially for very defensive allocations, we see that FX value is beneficial across the whole spectrum of risk profiles. Likewise, allocation to the FX carry trade replaces some of the high yield allocation, reflecting its close association with genuine equity and credit risk. and commodities."


Are you looking for more strategies to read about? Check http://\/\/new-fmhwbzh6ghd9hede.swedencentral-01.azurewebsites.net/Screener

Do you want to see performance of trading systems we described? Check http://\/\/new-fmhwbzh6ghd9hede.swedencentral-01.azurewebsites.net/Chart/Performance

Do you want to know more about us? Check http://\/\/new-fmhwbzh6ghd9hede.swedencentral-01.azurewebsites.net/Home/About


Follow us on:

Facebook: https://www.facebook.com/quantpedia/

Twitter: https://twitter.com/quantpedia

Continue reading »

Short-Term Return Reversals and Intraday Transactions

A new financial research paper has been published and is related to:

#31 – Short Term Reversal in Stocks

Authors: Miwa

Title: Short-Term Return Reversals and Intraday Transactions

Link: https://papers.ssrn.com/sol3/papers.cfm?abstract_id=3174484

Abstract:

I examine whether a short-term reversal is attributed to past intraday or overnight price movements. The results show that intraday returns significantly reverse in the following week, while overnight returns do not, indicating that the short-term reversal is attributed to past intraday price movements. In addition, the reversal of intraday returns is stronger for more illiquid stocks and during more volatile market conditions, while the reversal is unaffected by fundamental news. This result supports the view that short-term reversals are attributable mainly to price concessions for liquidity providers to absorb intraday uninformed transactions, rather than intraday price reactions to fundamental information.

Notable quotations from the academic research paper:

"In this study, I advance the understanding of drivers of short-term return reversals by a careful examination of when temporal price mispricing or concessions, resulting in short-term reversals, accrue. In particular, I decompose short-term return reversals into reversal of overnight return and that of intraday returns.

Though I am the first to decompose short-term return reversals in this way, such a decomposition is natural, because these two periods differ along several key dimensions. Fama (1965) shows that volatility is higher during trading hours (intraday) than it is during non-trading hours (overnight), and Kelly and Clark (2011) suggest that overnight stock returns are, on average, higher than intraday returns. Thus, decomposing return reversals into overnight and intraday return components could yield new and important information on the drivers of the short-term return reversal.

I find that short-term return reversal is mainly attributed to reversal of lagged intraday returns. In other words, intraday returns significantly reversed in the following week, while overnight returns do not. These results hold strongly in each international sample (i.e., US stocks, Japanese stocks, UK stocks, and Eurozone stocks). Even after excluding one-day returns in order to avoid the bid-ask bias, the strong intraday return reversal remains. Furthermore, this finding is robust to a variety of controls and risk-adjustments.

The two competing explanations for short-term reversals raise the question of whether the reversal of intraday returns results from a reaction to new information which occurs intraday, or from a price concession to absorb intraday transactions.

I attempt to address this question in two steps. I first examine whether the negative association between intraday returns and subsequent returns is stronger arounf fundamental news. If a reversal of intraday returns is attributed to a price reaction to fundamental news which occurs intraday, the negative association should be strengthened by the existence of fundamental news.

Then I analyze whether a reversal of intraday returns is stronger when liquidity providers request higher compensation. To this end, I examine whether the reveral of intraday returns is associated with a volatility index.

The analysis reveals that reversals of intraday returns are not stronger around news, indicating that the overreaction explanation is not plausible for the short-term reversals. On the other hand, reversals of intraday returns are stronger for illiquid stocks and when the volatility index is higher. These results support the view that reversals of intraday returns are attributed to price concessions that enable liquidity providers to absorb intraday transactions. The finding supports the lliquidity explanation."


Are you looking for more strategies to read about? Check http://\/\/new-fmhwbzh6ghd9hede.swedencentral-01.azurewebsites.net/Screener

Do you want to see performance of trading systems we described? Check http://\/\/new-fmhwbzh6ghd9hede.swedencentral-01.azurewebsites.net/Chart/Performance

Do you want to know more about us? Check http://\/\/new-fmhwbzh6ghd9hede.swedencentral-01.azurewebsites.net/Home/About


Follow us on:

Facebook: https://www.facebook.com/quantpedia/

Twitter: https://twitter.com/quantpedia

Continue reading »

Interesting Insights into Trend-Following Strategies

Related to all trendfollowing strategies:

Authors: Sepp

Title: Trend-Following Strategies for Tail-Risk Hedging and Alpha Generation

Link: https://papers.ssrn.com/sol3/papers.cfm?abstract_id=3167787

Abstract:

Because of the adaptive nature of position sizing, trend-following strategies can generate the positive skewness of their returns, when infrequent large gains compensate overall for frequent small losses. Further, trend-followers can produce the positive convexity of their returns with respect to stock market indices, when large gains are realized during either very bearish or very bullish markets. The positive convexity along with the overall positive performance make trend-following strategies viable diversifiers and alpha generators for both long-only portfolios and alternatives investments.

I provide a practical analysis of how the skewness and convexity profiles of trend-followers depend on the trend smoothing parameter differentiating between slow-paced and fast-paced trend-followers. I show how the returns measurement frequency affects the realized convexity of the trend-followers. Finally, I discuss an interesting connection between trend-following and stock momentum strategies and illustrate the benefits of allocation to trend-followers within alternatives portfolio.

Notable quotations from the academic research paper:

"Key takeaways:

1. The skewness and the convexity of strategy returns with respect to the benchmark are the key metrics to assess the risk-profile of quant strategies. Strategies with the significant positive skewness and convexity are expected to generate large gains during market stress periods and, as a result, convex strategies can serve as robust diversifiers. Using benchmark indices on major hedge fund strategies, I show the following.
– While long volatility hedge funds produce the positive skewness, they do not produce the positive convexity.
– Tail risk hedge funds can generate significant skewness and convexity, however at the expense of strongly negative overall performance.
– Trend-following CTAs can produce significant positive convexity similar to the tail risk funds and yet trend-followers can produce positive overall performance delivering alpha over long horizons.

Skewness of monthly returns of Quant Hedge Fund strategies

2. Trend-following strategies adapt to changing market condition with the speed of changes proportional to the trend smoothing parameter for the signal generation. As result, when we measure the realized performance of a trend-following strategy, the return measurement frequency should be low relative to the expected rebalancing period of the trend-following strategy. Using the data of SG Trend-following CTAs index, I show that trend-followers are expected to produce both the positive skewness and convexity for monthly, quarterly and annual returns. As a result, trend-following strategies should not be seen as diversifiers for short-term risks measured on the scales less than one month. Overall, I recommend applying quarterly returns for the evaluation of the risk-profile of a trend-following strategy.

Betas of SG Trend following CTAs to S&P 500 Index

3. By analyzing quarterly returns on the SG trend-following CTAs index conditional on the quantiles of quarterly returns on the S&P 500 index, I show that trend-following CTAs can serve as diversifiers of the tail risk. On one hand, the trend-followers generate significant positive average returns with positive skewness conditional on negative returns on the S&P 500 index. On the other hand, the trend-followers generate large positive returns, but with insignificant skewness conditional on large positive returns on the S&P 500 index. Conditional on index returns in the middle of the distribution during either range-bound or slow up-drifting markets, the trend-followers generate negative returns yet with significant positive skewness.

Quarterly Returns on SG Trend Following CTAs

4. The nature of trend-followers is to benefit from markets where prices and returns are auto-correlated, which implies the persistence of trends over longer time horizons. I present the evidence that the recent underperformance of trend-followers since 2011 to 2018 could be explained because the lag-1 autocorrelation of monthly and quarterly returns on the S&P 500 index become significantly negative in this sample period. The negative autocorrelation indicates the presence of the mean-reverting regime, even though the overall drift is positive, in which trend-followers are not expected to outperform. I introduce an alternative measure of the autocorrelation that can be applied to test for the presence of autocorrelation in short sample periods. I show that my autocorrelation measure has a strong explanatory power for returns on SG trend-following CTAs index.

Average Quartlerly returns of Trend Following CTAs

5. To quantify the relationship between the trend smoothing parameter, which defines fast-paced and slow-paced trend-followers, and the risk profile of fast-paced and slow-paced trend-followers, I create a quantitative model for a trend-following system parametrized by a parameter of the trend smoothing and by the frequency of portfolio rebalancing. The back-tested performance from my model has a significant correlation with both BTOP50 and SG trend-following CTAs indices from 2000s using the half-life of 4 months for the trend smoothing.

Position sizing

6. Using the trend system parametrized by the half-life of the trend smoothing, I analyze at which frequency of returns measurement the trend-following strategy can generate the positive convexity. The key finding is that the trend-following system can generate the positive convexity when the return measurement period exceeds the half-life of the trend smoothing and the period of portfolio rebalancing. I recommend the following.
– If a trend-following strategy is sought as a tail risk hedge with a short-time horizon of about a quarter, allocators should seek for trend-followers with relatively fast smoothing of signals with the average half-life less than a quarter.
– If a trend-following strategy is sought as an alpha strategy with a longer-time horizon, allocators should seek for trend-followers with medium to low smoothing of signals with the average half-life between a quarter and a year.
An alternative way to interpret the speed of the trend smoothing is to analyze the trend-following strategy beta to the underlying asset. For the slow-moving smoothing, the strategy maintains the long exposure to the up-trending asset with infrequent rebalancing. As a result, the higher is the half-life of the trend smoothing, the higher is the beta exposure to the index. Thus, while fast-paced trend-followers can provide better protection during sharp short-lived reversals, they suffer in periods of choppy markets. There is an interesting article on Bloomberg that some of fast-paced trend-following CTAs fared much better than slower-paced CTAs during the reversal in February 2018.

Linear Beta of S&P 500 Trend Following strategies

7. I examine the dependence between returns on the trend-following CTAs and on the market-neutral stock momentum. I show that the trend-followers have a stronger exposure to the autocorrelation factor and a smaller exposure of higher-order eigen portfolios. As a result, the trend-following CTAs produce the positive convexity while stock momentum strategies generate the negative convexity of their returns.

Strategy Betas to Principal Eigen Portfolios

8. The allocation to trend-following CTAs within a portfolio of alternatives can significantly improve the risk-profile of the portfolio. In the example using HFR Risk-parity funds and SG trend-following CTAs index, the 50/50 portfolio equally allocated to Risk-parity funds and trend-following CTAs produces the drawdown twice smaller than the portfolio fully allocated to Risk-parity funds. The 50% reduction in the tail risk is possible because the occurrence of the drawdowns of Risk-parity HFs and Trend-following CTAs are independent. While trend-followers tend to have lower Sharpe ratios than Risk-parity funds, trend-followers serve as robust diversifiers with 50/50 portfolio producing the same Sharpe ratio but with twice smaller drawdown risk.

Sharpe Ratio vs Maximum Drawdown

"


Are you looking for more strategies to read about? Check http://\/\/new-fmhwbzh6ghd9hede.swedencentral-01.azurewebsites.net/Screener

Do you want to see performance of trading systems we described? Check http://\/\/new-fmhwbzh6ghd9hede.swedencentral-01.azurewebsites.net/Chart/Performance

Do you want to know more about us? Check http://\/\/new-fmhwbzh6ghd9hede.swedencentral-01.azurewebsites.net/Home/About


Follow us on:

Facebook: https://www.facebook.com/quantpedia/

Twitter: https://twitter.com/quantpedia


Continue reading »

Quantpedia Update – 22nd May 2018

One new strategy has been added:

#390 – Lottery Stocks and the 52-Week High

Two new related research papers have been included into existing strategy reviews. And two additional related research papers have been included into existing free strategy reviews during last 2 weeks.

Continue reading »

Do Hedge Funds Ride Market Irrationality or Bet Against It ?

A nice peak into the hedge funds industry kitchen. At the end, it is an additional evidence that a lot of hedge funds are trend-followers. And the main reason is that they are more successful because of it :

Authors: Liang, Zhang

Title: Do Hedge Funds Ride Market Irrationality?

Link: https://papers.ssrn.com/sol3/papers.cfm?abstract_id=3018483

Abstract:

We document significant evidence that hedge funds temporarily ride rather than attack high market irrationality but neither ride irrationality in the long run nor ride low irrationality. Hedge funds actively ride market irrationality during the formation period of the tech bubble in 2000 but not during the formation period of the housing bubble in 2007. Irrationality-riding funds outperform irrationality-attacking funds by 4.4% per year on a risk-adjusted basis. This outperformance is attributed to irrationality-riding during high irrationality periods-the formation period of the tech-bubble, and the bursting period of the housing bubble. The adoption of irrationality riding strategy is related to manager skill as well as investment styles. Our results are consistent with the behavioral theories that sophisticated investors ride rather than attack unsophisticated investors’ strong misperception. Finally, we do not find that mutual fund managers have the irrationality riding ability.

Notable quotations from the academic research paper:

"The conventional efficient market hypothesis (e.g., Freidman, 1953; Fama, 1965; Fama and French, 1996; Ross, 2001) suggests that rational investors attack market irrationality by conducting arbitrage trades to correct mispricing quickly and profit from their attacking strategy.

In contrast, behavioral studies (e.g., Delong, Shleifer, Summers and Waldman, 1990b; Abreu and Brunnermeier, 2002, 2003; Dumas, Kurshev and Uppal, 2009; Mendel and Shleifer, 2012) claim that rational investors choose to temporarily ride rather than attack noise traders’ high irrationality because the corresponding arbitrage may not be implementable. More interestingly, the behavior theory predicts that riding funds outperforms attacking funds, which is opposite to the conventional efficient market hypothesis theory.

This goal of this study is to distinguish the above two opposing views by empirically testing whether hedge funds, as rational investors, ride noise traders’ high irrationality in short run. Using a large sample of 5,617 equity-oriented hedge funds from the Lipper TASS database over the period from January 1994 to December 2013, we examine whether hedge fund managers ride or attack noise traders’ irrationality, by comparing the percentage of irrationality-riding funds with the portion of irrationality-attacking funds.

Following convention in the noise trading literature, we choose the noise trader sentiment index approximated by the Index of Consumer Sentiment from the University of Michigan as our base proxy for market-wide irrationality.2 We measure irrationality-riding via the timing coefficient in the conventional market timing models. Both the efficient market hypothesis and behavioral theory imply that hedge funds riding market irrationality should have significantly positive coefficients on the interaction term of the market index and the sentiment index, while funds that attack irrationality should have negative coefficients to offset the effect of irrationality on stock prices.

Out of the entire sample, about 20% of hedge fund managers have t-statistics of the riding coefficients equal to or greater than 1.65. The portion of hedge funds with a t-statistic equal to or lower than -1.65 is only 4.6%. These facts suggest that hedge fund managers do not attack, but ride noise traders’ irrationality.

This distribution pattern of the t-statistic significantly varies across investment styles. For example, 62.5% of multi-strategy funds and 35% of global macro funds adopt irrationality-riding strategy but the fraction of irrationality-riding funds among equity market neutral, convertible arbitrage or event driven funds is trivial. Moreover, the fraction of hedge funds with a t-statistic of riding coefficient equal to or greater than 1.65 is 31.4% during the high irrationality periods and is reduced to 17.0% during the lower irrationality periods. This fraction is 32.4% during normal time and 14.4% during the period of two financial crises, including the tech bubble crisis from March 2000 to December 2002 and the subprime crisis from June 2007 to December 2009. Hedge funds actively ride market irrationality during the tech bubble formation period from January 2000 to February 2000, but not during the housing bubble formation period from January 2005 to May 2007. Hedge fund managers do not show meaningful propensity to ride market irrationality in the long run either. The proportion of funds that choose to ride the 12-month leading market irrationality is smaller than the proportion that chooses to attack.

Further, we investigate whether hedge funds’ irrationality-riding choice is attributed to randomness or skill. In sum, our empirical results are consistent with the behavioral theory but not with the efficient market theory. We conclude that hedge fund managers choose to ride high market irrationality in the short run but to attack it in the long run.

Given the fact that market irrationality-riding is generally adopted by hedge funds, we examine whether this strategy is economically significant by comparing the performance of irrationality-riding funds with irrationality-attacking funds in subsequent periods.

The performance difference between the riding and attacking funds in the subsequent periods is consistent with the behavioral predictions but against the predictions of the efficient market hypothesis. The Fung and Hsieh (2004) seven-factor alpha delivered by the riding portfolio is at least 0.31 % per month, or equivalently 3.7% per year, significantly higher than that of the attacking portfolio over the subsequent one to twelve months. The risk-adjusted outperformance of the riding funds relative to the attacking funds in next one month is 0.49% (t-stat=12.02) during the high irrationality periods and -0.03% (t-stat=-0.90) during the low irrationality periods."


Are you looking for more strategies to read about? Check http://\/\/new-fmhwbzh6ghd9hede.swedencentral-01.azurewebsites.net/Screener

Do you want to see performance of trading systems we described? Check http://\/\/new-fmhwbzh6ghd9hede.swedencentral-01.azurewebsites.net/Chart/Performance

Do you want to know more about us? Check http://\/\/new-fmhwbzh6ghd9hede.swedencentral-01.azurewebsites.net/Home/About


Follow us on:

Facebook: https://www.facebook.com/quantpedia/

Twitter: https://twitter.com/quantpedia


Continue reading »
QuantPedia
Privacy Overview

This website uses cookies so that we can provide you with the best user experience possible. Cookie information is stored in your browser and performs functions such as recognising you when you return to our website and helping our team to understand which sections of the website you find most interesting and useful.