Over the past seven decades, U.S. equity-market volatility has roughly doubled—from about 10% to 20%—and this increase is concentrated at the market level and at high frequencies (daily volatility up by ~130%, weekly by ~75%, monthly by ~40%). A new paper by Lars Lochstoer and Tyler Muir argues that this structural change is not driven by macroeconomic fundamentals or firm-level shocks but by the dramatic growth of index-level trading (futures, ETFs, index mutual funds, and extended trading hours). Using statistical investigations—the 1997 introduction of E‑mini S&P 500 futures and historical NYSE trading‑hour changes—the authors provide causal evidence that easier and larger trading of the market portfolio has raised aggregate volatility through higher trading volume and a shift toward systematic demand shocks.
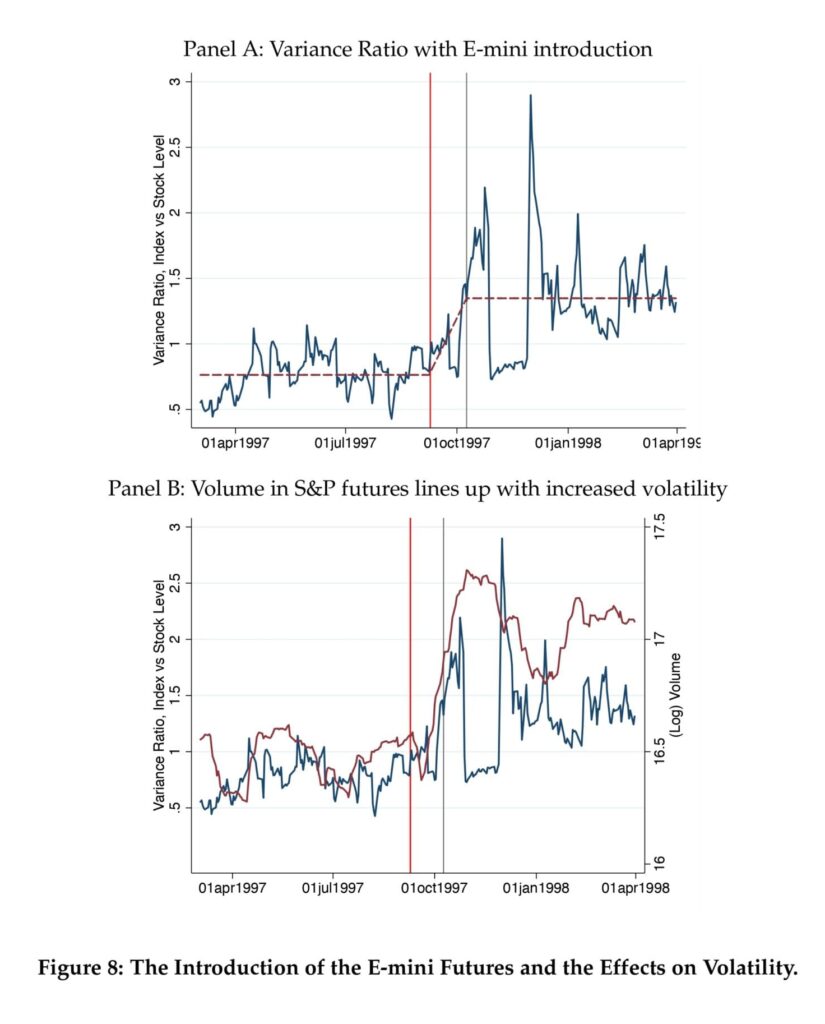
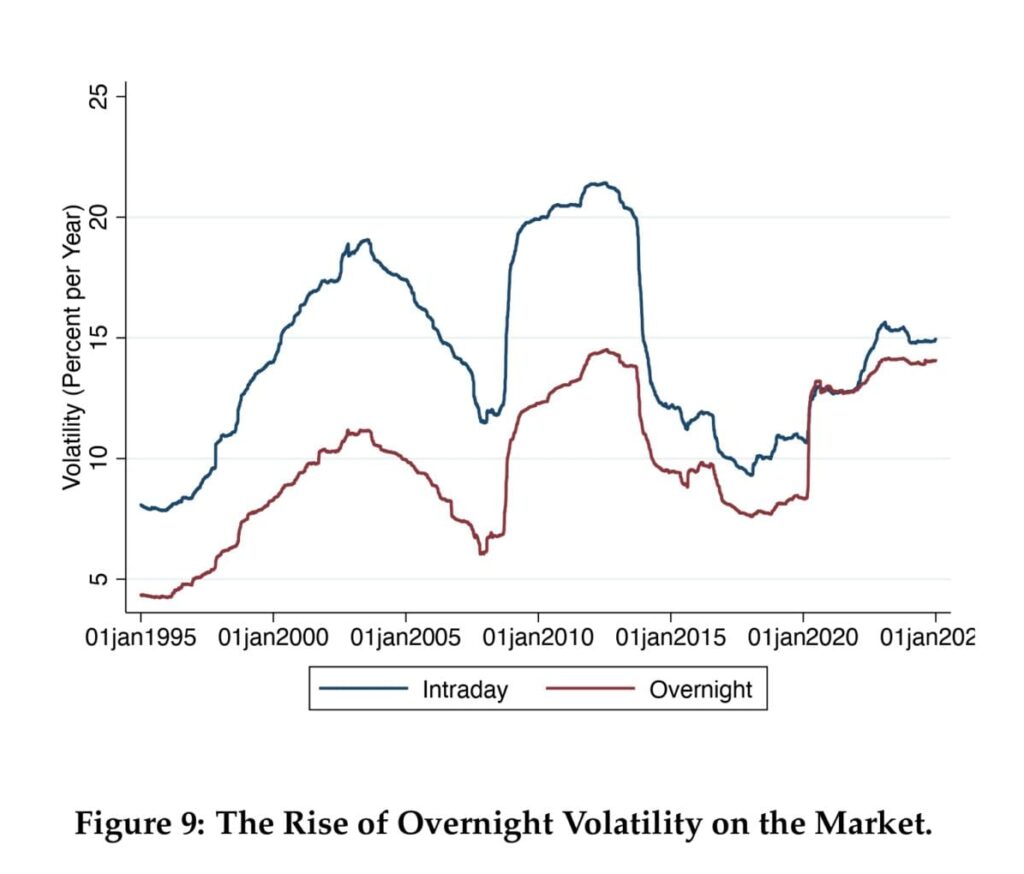
The authors document three core empirical patterns: (1) volatility increases are concentrated in market-wide returns rather than idiosyncratic firm risk, (2) the rise is most substantial at short horizons (intraday and overnight variance), and (3) stock‑level trading has become more proportional to market capitalization, captured by a market volume beta that has roughly doubled over 70 years. Natural experiments deliver causal magnitudes: expanding trade volume increases both volume and volatility, and a 10% rise in aggregate trading volume is associated with roughly a 7–14% increase in market volatility. Intraday evidence around the E‑mini launch shows a marked jump in overnight and intraday market variance, absent in idiosyncratic components.
A simple demand‑shock model rationalizes the facts: index trading concentrates investor flows into the market portfolio, forcing arbitrageurs to absorb larger systematic demand shocks and thereby raising market variance, lowering return autocorrelation, and increasing the share of variance explained by common factors. Practically, this means higher short‑term volatility, a larger number of stocks required for diversification, and materially different portfolio allocations (the mean‑variance optimal equity share falls as variance rises). The results also carry policy relevance: market design choices that expand trading capacity or around‑the‑clock access (for example, proposals for 24‑hour trading) can amplify aggregate volatility because index trading is both large in scale and intrinsically trade‑intensive rather than passive in its price impact.
Authors: Lars A. Lochstoer and Tyler Muir
Title: (Why) Have Financial Markets Become More Volatile? The Role of Market Index Trading
Link: https://ssrn.com/abstract=5655370
Abstract:
We document a persistent doubling of U.S. stock market volatility since the mid-20th century, which cannot be attributed to macroeconomic fundamentals or idiosyncratic firm shocks. Instead, we show that the increased volume and dominance of index trading-via futures, ETFs, and extended trading hours-has structurally raised aggregate stock market volatility. We exploit the introduction of E-mini S&P 500 futures and historical NYSE trading-hour adjustments as natural experiments to provide causal evidence that index-level trading amplifies market variance through trading volume. Our model of index demand shocks rationalizes these findings, predicting higher market-level volatility, reduced return autocorrelation, and an increased share of systematic risk. Fluctuations in asset prices and volatility are increasingly determined by technology and trading structure rather than fundamentals.
As always, we present several interesting figures and tables:
Notable quotations from the academic research paper:
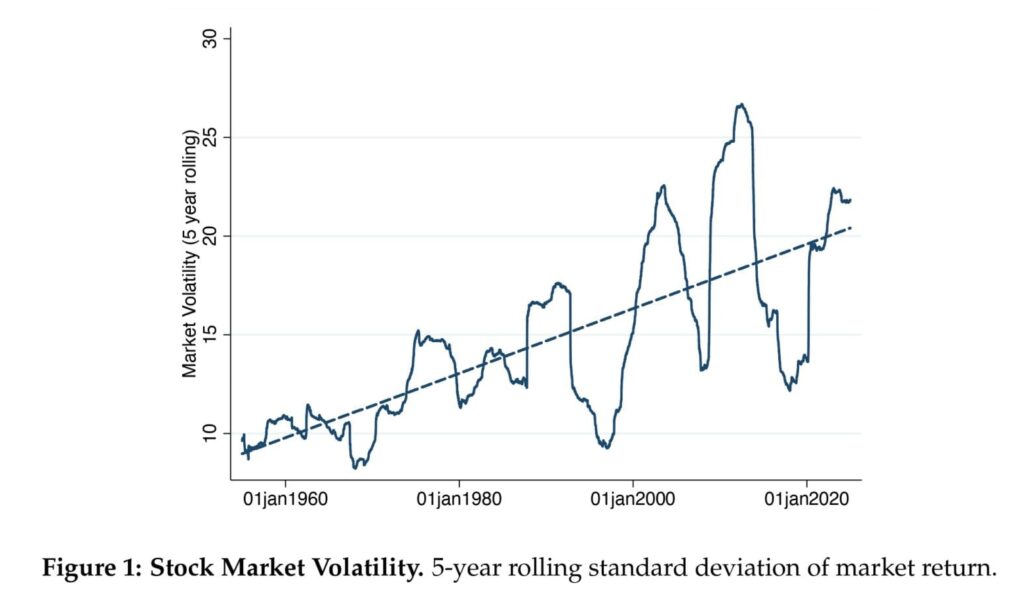
“Over the past seventy years, stock market volatility has roughly doubled from 10% to 20%. Figure 1 plots the volatility of the US stock market from the 1950’s to today using 5-year rolling windows from daily data on the value-weighted market return. The increase in volatility is not explained by changes in the volatility of economic fundamentals, which has remained stable or declined, and it holds when we strip out recessions or extreme events. Further, we show that volatility has risen most at high frequencies (daily volatility is up 130%, weekly 75%, monthly 40%), consistent with changes in the market itself rather than changes in fundamentals. The increase is concentrated at the market level so that idiosyncratic volatility now accounts for a smaller share of stock-level volatility.
The increase in volatility in Figure 1 indeed lines up in time with the growth of index trading and volume rather than macroeconomic fundamentals. We show that overall stock market volume has increased dramatically and that more of this volume looks like “market index” trades in that stock-level volume on a given day is much more proportional to market capitalization than it used to be. We derive a market volume beta – the tendency of the volume of all stocks in given day to be proportional to their market capitalizations – and show that this measure has doubled over the past 70 years. While suggestive, these correlations alone do not mean that trading volume in market index products cause volatility – volatility could instead attract trading volume, or other factors could affect both volume and volatility.
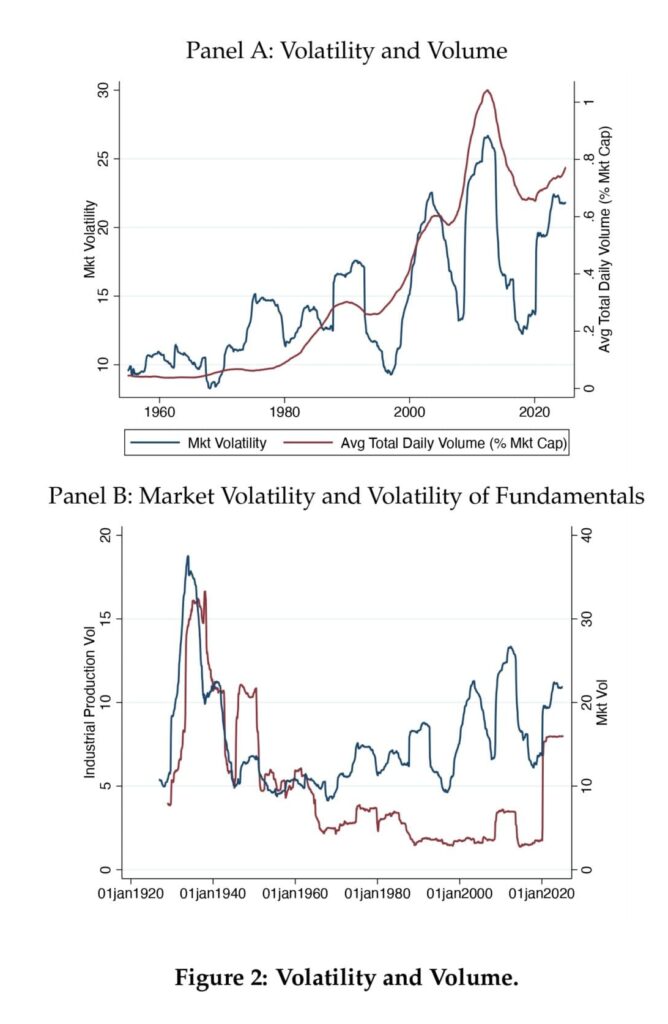
Figure 2 Panel A plots market volatility against total stock market volume as a share of total market capitalization. There is a strong correlation between trading volume and volatility since the 1960’s, both in terms of low frequency trend and in the cyclical movements. A natural story is that higher trading activity leads to higher volatility, especially for shorter horizon returns. This fits well with the return-horizon pattern we’ve shown so far. Of course, there could be other factors affecting both volatility and volume, and in addition high volatility could lead to more demand for trading activity, a reverse causality story. In Section 3.1 we document a causal relation between volume and volatility by using changes in trading hours as an instrument for volume as well as the introduction of the e-mini futures.
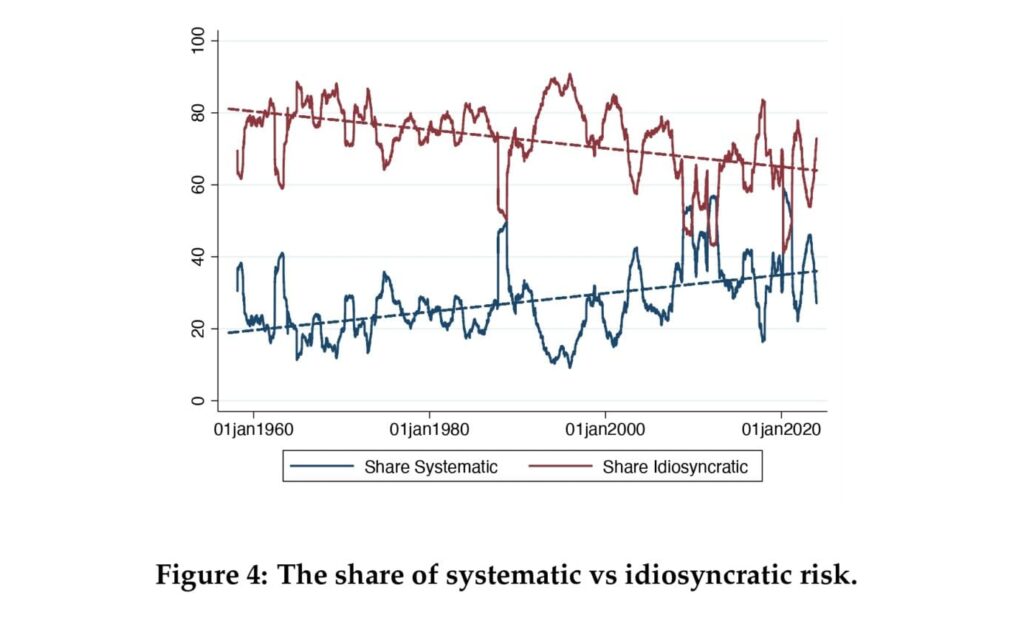
Figure 4 plots the results. The systematic share rises from 19% in 1960 to around 35% today, while the idiosyncratic share falls by the same amount. This roughly equates to a doubling of systematic risk over the sample. Thus, we conclude that the majority of the rise in volatility we document is coming from market risk but that this pattern is not equally mirrored in idiosyncratic risk.
The stock market has transformed over the past 60 years, with the proliferation of index products (index futures, index ETFs, and passive mutual fund products). Far from being “passive”, the volume of trade in these products is enormous. We provide causal evidence that this volume has contributed substantially to increased volatility of the overall stock market.”
Are you looking for more strategies to read about? Sign up for our newsletter or visit our Blog or Screener.
Do you want to learn more about Quantpedia Premium service? Check how Quantpedia works, our mission and Premium pricing offer.
Do you want to learn more about Quantpedia Pro service? Check its description, watch videos, review reporting capabilities and visit our pricing offer.
Are you looking for historical data or backtesting platforms? Check our list of Algo Trading Discounts.
Would you like free access to our services? Then, open an account with Lightspeed and enjoy one year of Quantpedia Premium at no cost.
Or follow us on:
Facebook Group, Facebook Page, Twitter, Linkedin, Medium or Youtube


